We helped leading ecommerce brand reduce customer churn and reengage their buyers with data analytics and data strategy

Successful Reengagement Strategy | 5 Key Customer Segments Defined | Efficient Reengagement Parameters Defined:
-
9% Reduced Customer Churn Rate
-
Discount sweet spots for each segment
- Efficient Reengagement timelines: 18 days
A leading kidswear ecommerce brand in India with over 2 million customers was facing a growing customer retention problem. Nearly 46% of first-time buyers were not returning for a second purchase, creating a significant revenue leakage estimated at $2.5 million over six months.
The brand lacked a structured way to understand why one-time buyers churned or how to re-engage them effectively. Blanket promotions led to unnecessary discounting without meaningful uplift, while inconsistent targeting meant high-potential customers were often missed.
They needed a data-driven approach to identify the right customer segments, optimal timing, and incentive levels to improve repeat purchase rates without eroding margins or overwhelming marketing budgets.
The customer is the service arm of a leading global consumer electronics brand.
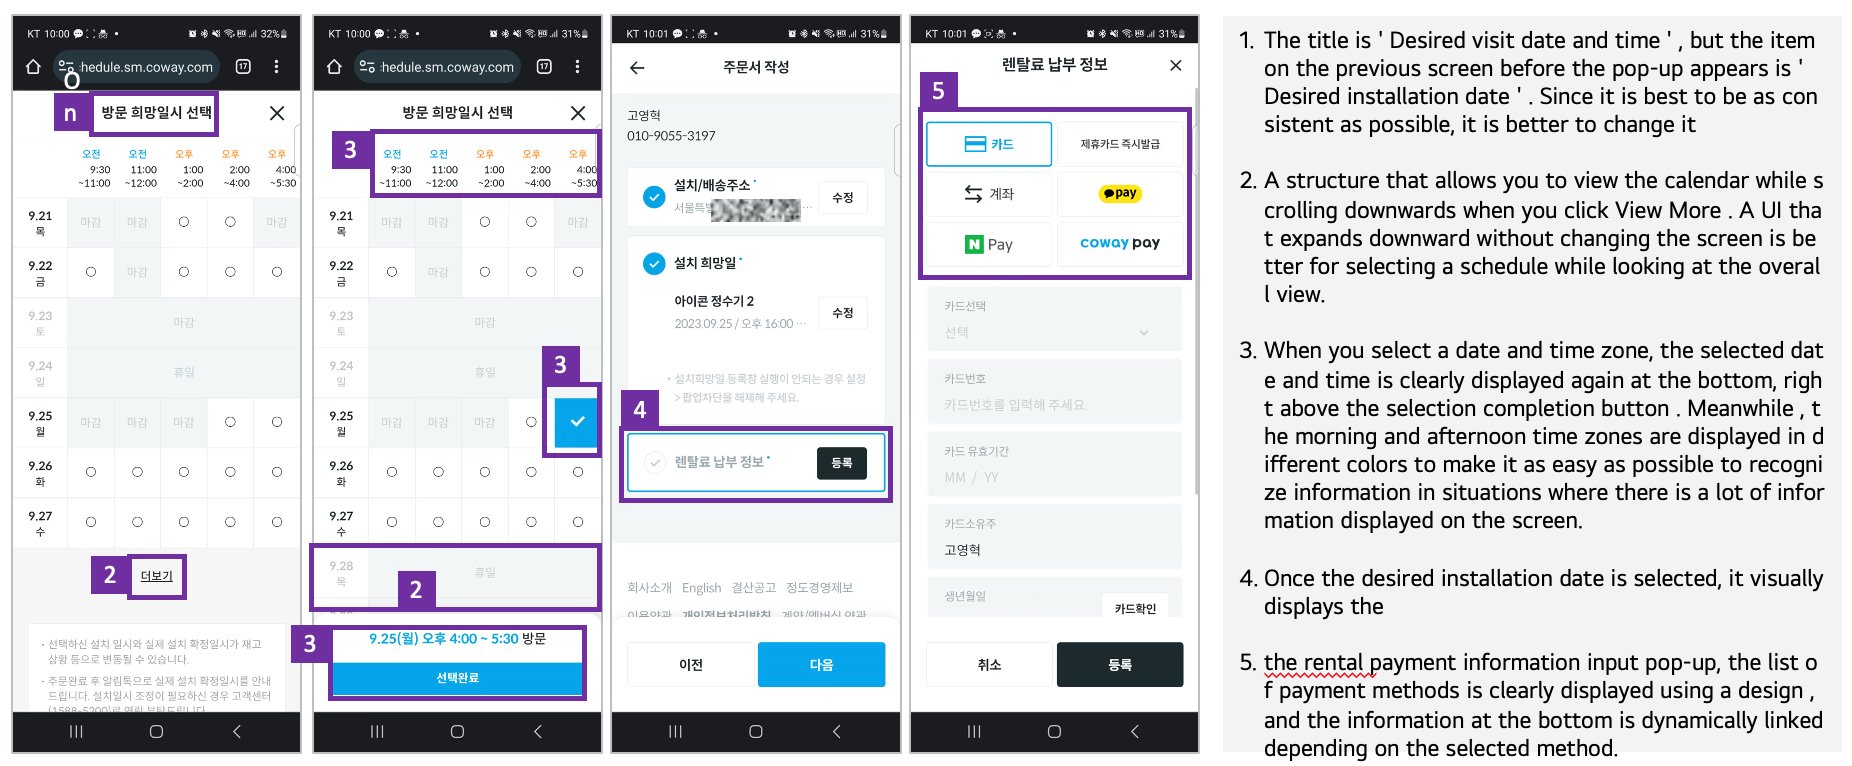
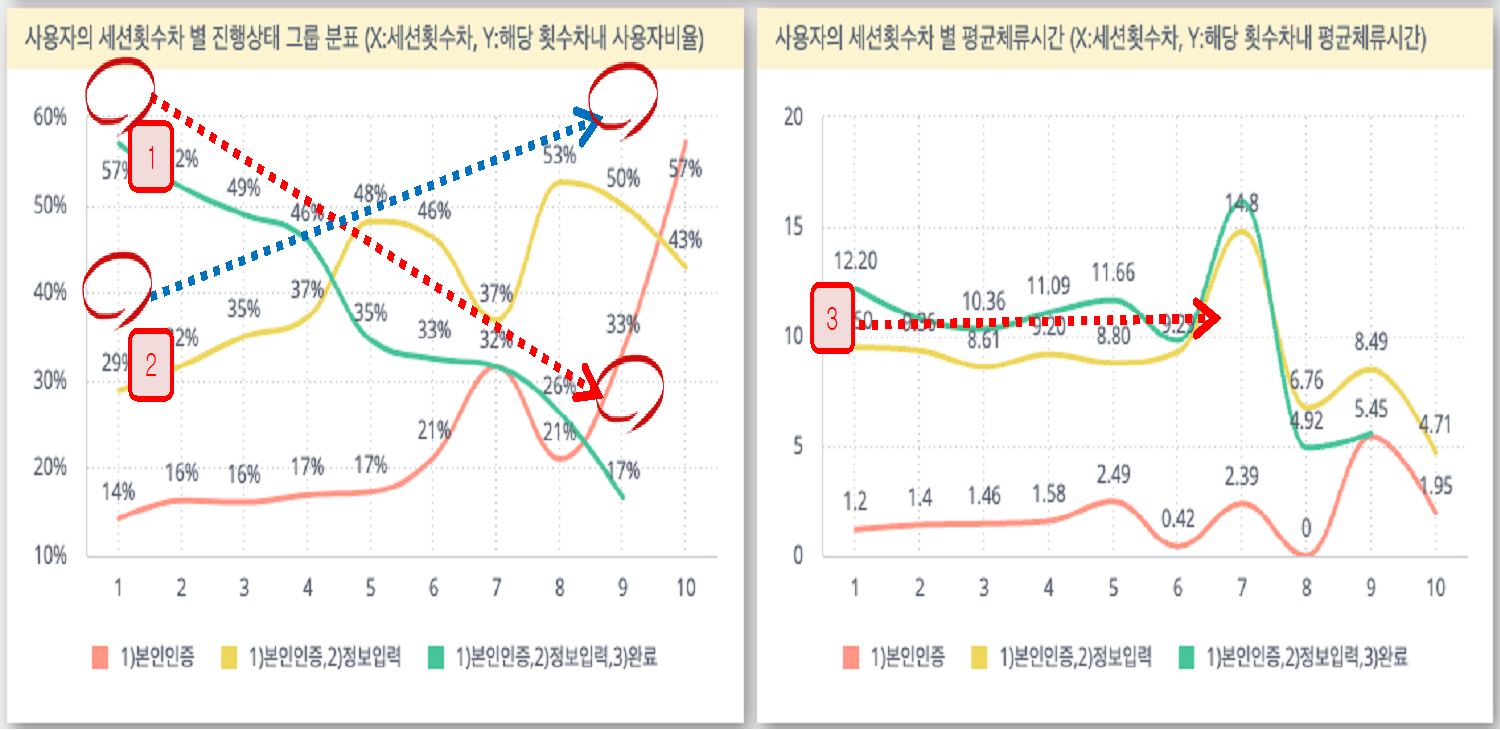
However, they had no concrete proof on how the website user experience affected service conversion rates. Previous attempts to improve the user experience was only based on qualitative analysis and was not backed up by data.
ADA helped by validating the quantitative analysis using internal UX experts benchmarking against competitor’s websites. We established an always-on monitoring system to facilitate design improvements to the website.
Subsequently ADA developed Data Solution Dashboards to pinpoint specific UI areas for improvement, analyzed user experience bottlenecks affecting user journey goals, and identified patterns for non-converting customers.
The data insights were the foundation for ADA’s UX redesign and website improvement plans.
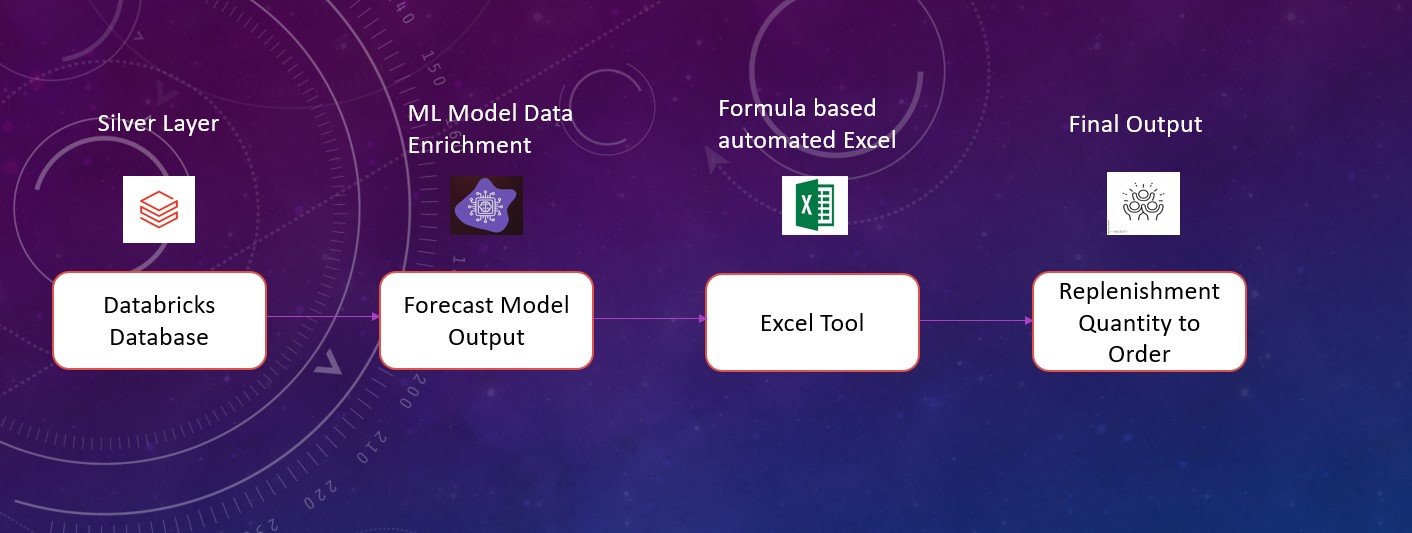
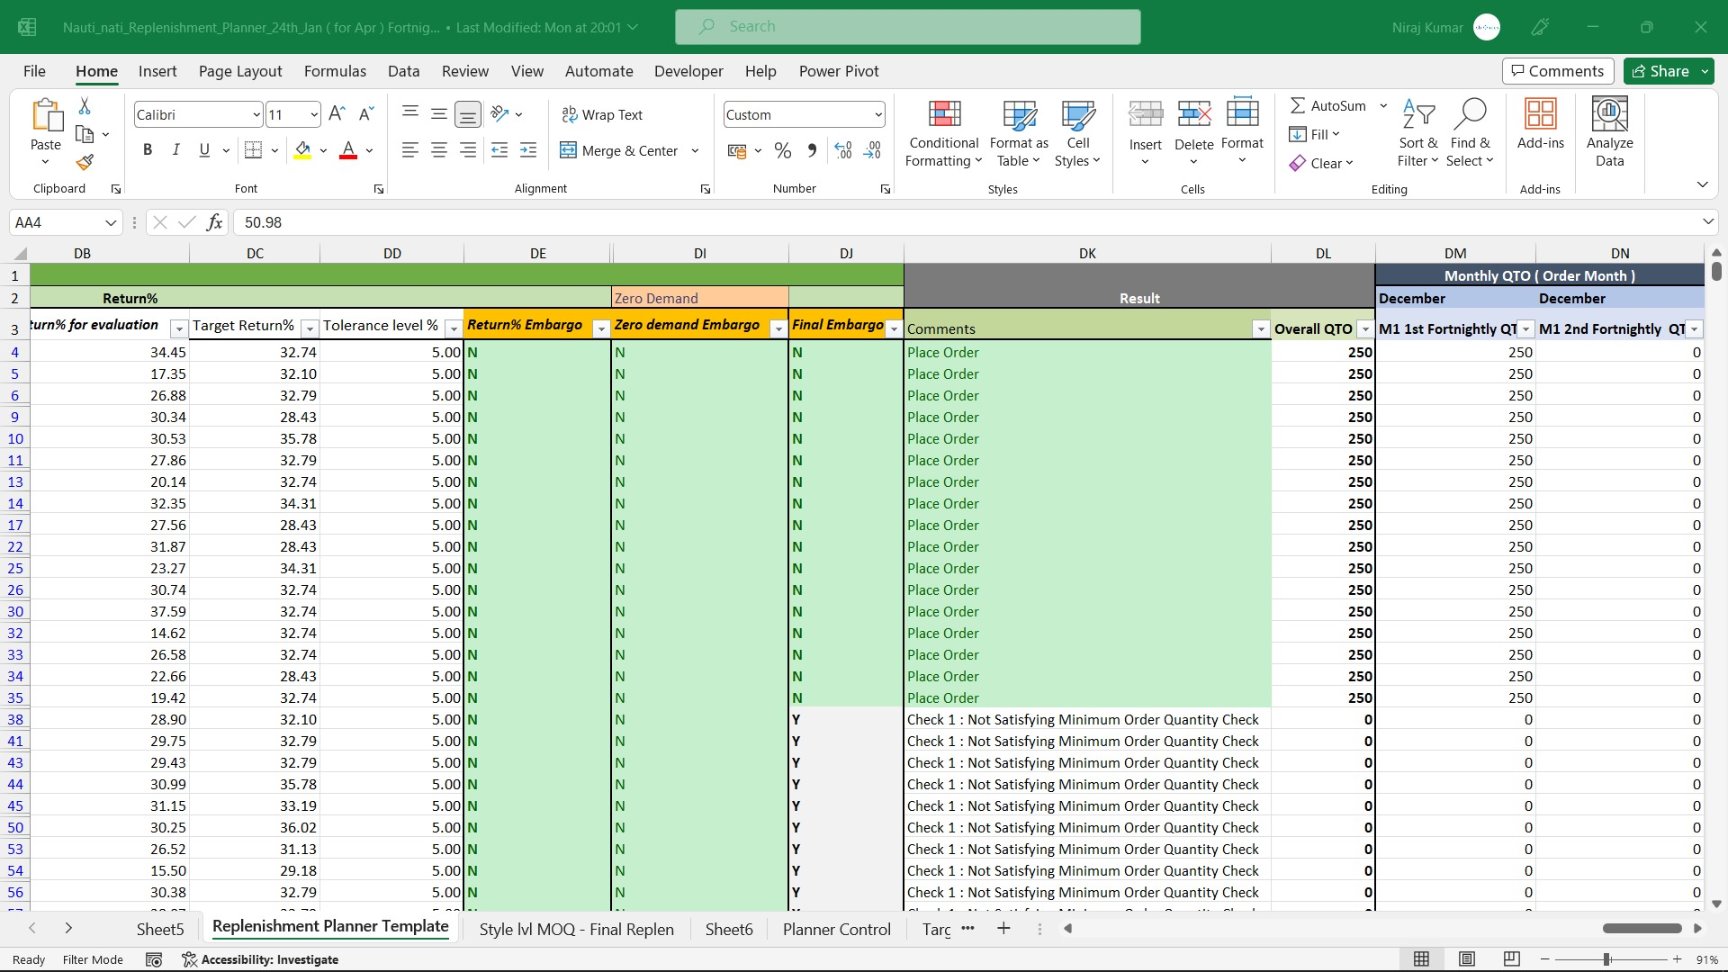
We developed a robust demand forecasting model leveraging advanced techniques including ARIMA, SEM, and Fb-Prophet, complemented by a user-friendly Excel tool for stakeholder convenience.
The Supply Chain and Growth teams now have access to a bi-weekly updated tool, providing a comprehensive overview of inventory levels at various tiers. This tool empowers teams with the flexibility to adjust and place inventory orders based on specific targets and requirements.
By enabling decision-making based on data-driven insights, our solution equips the Supply Chain and Growth teams to make more informed choices. This scientific approach enhances operational efficiency and ensures strategic decisions align with mathematical logic, driving sustainable business growth.