
How to Increase Average Order Value (AOV): 25+ Proven Ways

Digital Experience Personalization
Blogs

How to Increase Average Order Value (AOV): 25+ Proven Ways

Key Takeaways on Increasing AOV

  • AOV is the fastest revenue lever most ecommerce teams underuse — it requires no extra traffic, just smarter use of existing customers.
  • AI-powered recommendations are the highest-impact tactic, with typical AOV lifts of 15 to 30% — eXtra saw 52% using ADA Global Recommend™.
  • Product bundling drives 20 to 30% AOV uplift; customers who buy bundles have significantly higher lifetime value.
  • Free shipping thresholds set 15 to 25% above current AOV consistently push customers to add one more item.
  • Social proof and urgency signals reduce hesitation on higher-priced items — but only when they reflect real data.
  • RPV (Revenue Per Visitor) is the metric that tells you whether AOV gains are actually working.

Most ecommerce teams aren’t fully leveraging the biggest growth lever they actually own.

They’re running A/B tests on button colours. Reworking PDP layouts. Rebuilding checkout flows for the third time in two years.

All of that has value, but none of it directly answers a more important question: how to improve Average Order Value (AOV).

Even a 10% lift in AOV can drive significant incremental revenue without any additional traffic. It simply means the customers already on your site spend more per transaction.

The idea is straightforward. The mechanics aren’t complicated. What’s hard is prioritization.

In this blog, we discuss how to systematically improve average order value through merchandising, pricing, bundling, and on-site experience.

Want to know where your AOV and RPV are underperforming? Our RPV Teardown maps the gaps across your funnel and gives you a 90-day plan to fix them.

What is Average Order Value (AOV)?

AOV Definition

Average Order Value (AOV) is the average amount a customer spends per transaction on your site over a given time period. The reason it matters so much is that it sits at the intersection of two things every ecommerce business cares about: revenue and profitability.

Raising your conversion rate gets more people buying. Raising your AOV gets the people who are already buying to spend more. The second option is almost always cheaper and faster.


AOV Formula

The calculation is straightforward:

AOV = Total Revenue ÷ Number of Orders

Say your store did $500,000 in revenue last month from 5,000 orders. Your AOV is $100. If you increase that to $110 without changing your order volume or ad spend, you’ll be getting an extra $50,000.

But please make sure you’re excluding returns and refunds from your revenue. What matters is the AOV customers actually keep, not what they initially bought.

Gross AOV can look strong on paper, while returns quietly eat into your margins.


Where AOV is Used

AOV is most commonly talked about in ecommerce, but the concept applies across business models.

In ecommerce, it’s the metric with which bundling, cross-sell, and checkout  strategies are measured.

In SaaS, the equivalent  would be average revenue per user (ARPU). Whereas in marketplaces, AOV helps sellers assess whether their catalogue and pricing are working and gauge platform health.


AOV vs Conversion Rate vs Revenue Per Visitor

These three metrics are related but distinct. Let’s understand the difference.

Conversion rate (CVR) measures the percentage of visitors who complete a purchase. AOV measures how much those buyers spend. And Revenue per visitor (RPV) is the product of both: CVR × AOV, giving you a clear view of your store’s overall performance.

That distinction matters in practice.

For instance, you can increase conversion by lowering prices or simplifying checkout, but that might lower AOV. You can boost AOV by encouraging larger baskets, but that can hurt conversion rates.

So, it’s the RPV that tells you whether those trade-offs are actually working.
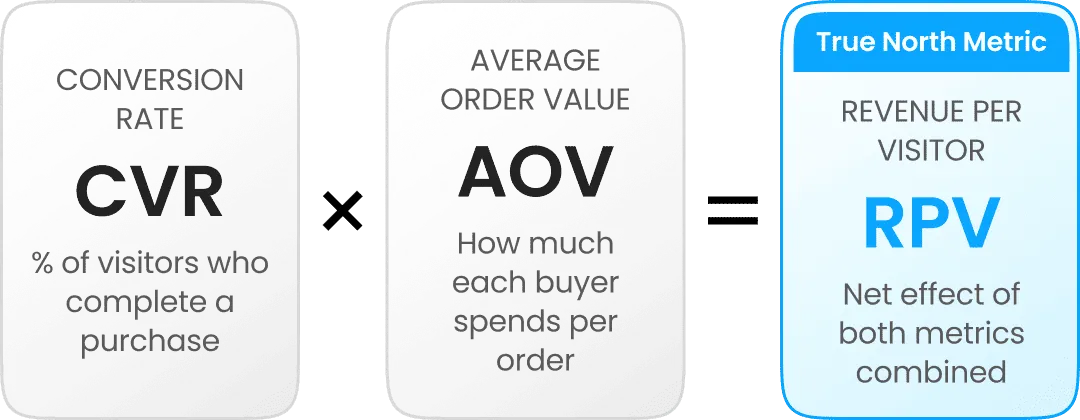
Instead of optimizing these metrics in isolation, consider them together. That’s how you know if you’re truly improving performance.

Why Average Order Value is a Critical Ecommerce Metric

AOV as a Revenue Growth Lever

Most growth conversations in ecommerce start with traffic. How do we get more visitors? How do we lower CPC? How do we improve paid ROAS? Those are real questions. But they’re also expensive questions to answer.

AOV is different. You’re working with buyers who’ve already pulled out their payment details. Getting them to spend 15% more is fundamentally different from convincing a cold audience to buy at all.

For a retailer with $50M in annual revenue, a 10% increase in AOV adds $5M to the top line. No new campaigns. No landing page rebuilds. No SEO overhaul.


Impact on Profitability

Revenue is one thing. Profitability is another. The reason AOV improvements are so profitable is that most of your order-level costs are fixed.

Fulfilment, packaging, customer service, and payment processing costs don’t double just because a customer adds a second item to their cart. So when AOV increases, the incremental revenue from that additional spend largely falls through to margin.

It’s not unusual to see gross margin per order improve by 5–8% just from an AOV initiative that didn’t involve discounting.

CAC payback improves as well. If your CAC is $40 and your average order is $100 with a 40% margin, you make $40 per order. That just covers your acquisition cost, so you break even.

Increase AOV to $120, and you now make $48 per order. After covering CAC, you’re left with $8 profit on the first purchase. That means every repeat purchase is profit from the start.


AOV and Customer Lifetime Value

High AOV and high LTV often go hand in hand, but not just by chance.

Customers who spend more on a single order are more invested. They are exploring more of your catalog, trusting your brand and buying with intent. That kind of behavior usually doesn’t end with one purchase.

In other words, higher AOV is often a signal, not just a result.

It tells you that these customers are more engaged, more likely to come back, and more valuable over time.

So AOV is not only about what we spend today. It’s a good indication of what they might be worth tomorrow.


Why Increasing AOV is More Efficient Than Traffic Growth

A 20% boost in organic traffic may take months of consistent content and SEO investment.

On the other hand, a 20% lift in AOV through a well-calibrated free shipping threshold or a strong cross-sell program can go live in as few as weeks.

That makes a difference.

Acquisition can often be a treadmill. You pay more to get new visitors, and CAC rises as competition increases.

AOV optimization is another story.

It taps into the demand you already have. And as you learn what your customers respond to, it’s easier and more efficient to maintain over time.

What is a Good Average Order Value?

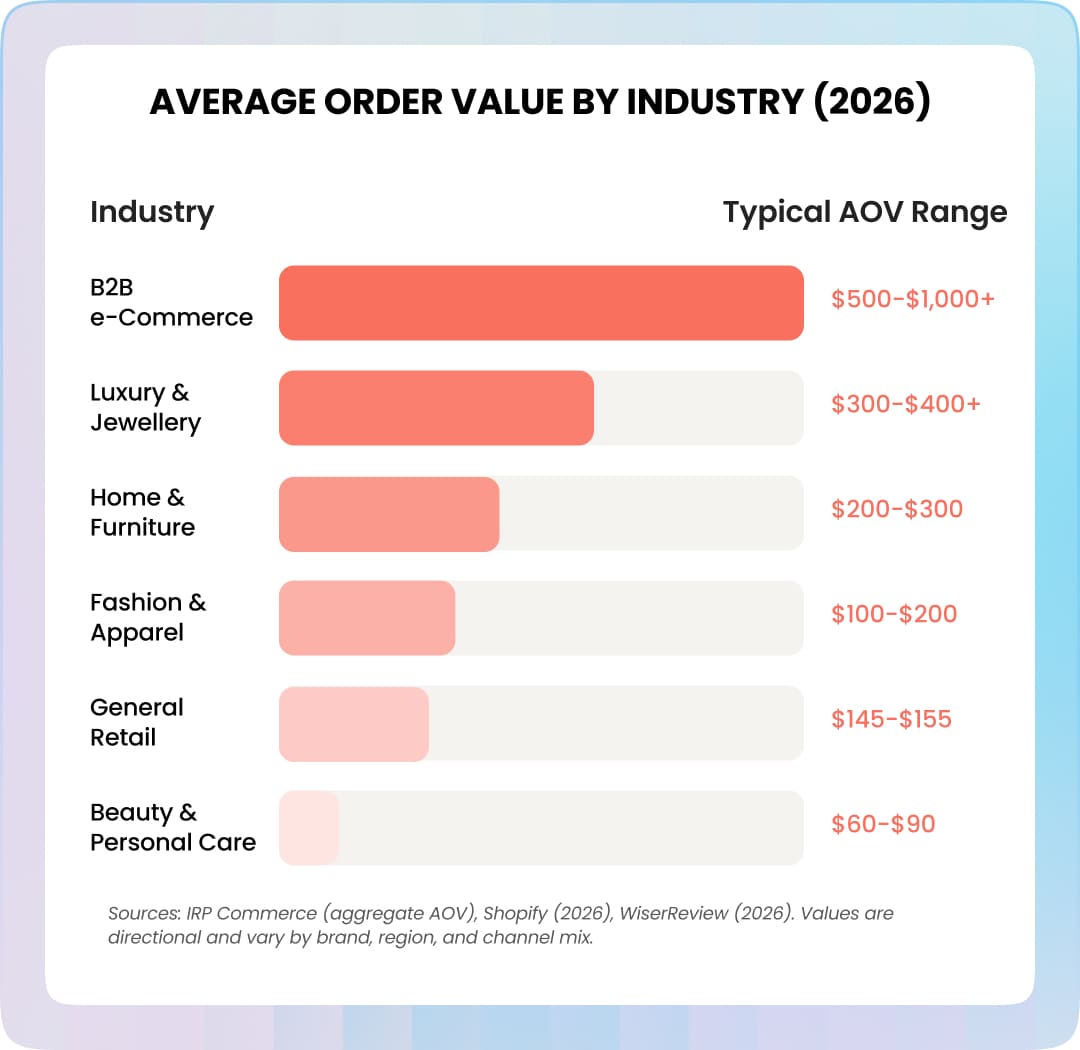
According to Shopify, the global average for all industries is $145 in 2026.

But benchmarking against the global average is meaningless. Here’s the AOV you should be aiming for in your industry:

AOV Benchmarks by Industry
Factors That Influence AOV

There are several factors that determine where your AOV lies, and understanding them will tell you which levers are worth pulling.

  • Product pricing: A store selling $20 accessories will have a structurally lower AOV than a store selling $200 footwear, no matter how strong its cross-sell strategy is.
  • Customer segment: Returning customers tend to spend more than first-time buyers. High-intent shoppers (such as branded search) also tend to have a higher AOV than broad awareness channels.
  • Geography: Purchasing power, shipping expectations, and spending behaviour vary widely by market, which determines how much customers are willing to spend per order.
  • Brand positioning: A brand positioning that suggests quality and premium value tends to attract customers who are willing to spend more per transaction.

How to Calculate Your Ideal AOV

Working backwards from your unit economics gives you a more realistic AOV target.

Begin with your CAC. If you acquire a customer for $60 and have a 45% gross margin, you need $133 in revenue just to break even on the first order. So the AOV has to be higher than $133 before you’re even profitable on acquisition, and that’s before fixed costs.

Run this calculation with your own numbers, and you will know where you are at very quickly. It shows whether your current AOV is healthy, marginal, or fundamentally misaligned with your business model.

How to Calculate and Track Average Order Value

Manual Calculation

Pull your total revenue for any period, divide by total completed orders in that same period, and you get AOV. The period matters as AOV changes with the seasons, so compare apples to apples (this November vs last November, not this November vs August).

Please note that you should always exclude cancelled and refunded orders from both numbers.


Tracking AOV in GA4

In GA4, you can measure the AOV in the Monetisation → Ecommerce Purchases report. The metric is called “Average Purchase Revenue.”

It’s really useful when you can segment it by traffic source, device type, geographic region and user type. For example, a 15% difference in AOV between mobile and desktop tells you there’s a checkout or product display problem.


Tracking in Shopify

Shopify’s Analytics dashboard places AOV front and centre in the Overview section.

A more useful view lies in “Sales by product” and “Sales by discount,” where you can cross-reference AOV with which products or promotions are in the mix.

So, you can see if a campaign that “improved” AOV actually did so because of higher-value items or just heavier discounting.


Using CDPs and Analytics Tools

Segment-level AOV tracking is where the real insights live. A customer data platform (CDP) lets you analyse AOV by cohort: loyalty members vs non-members, first-order vs fifth-order shoppers, and shoppers who engaged with recommendations vs those who didn’t. Without this segmentation, AOV is an average that masks the interesting details.

The 3 Core Levers to Increase Average Order Value

Before diving into tactics, let’s understand the three fundamental ways AOV moves.

  • Increase Items Per Order
    Encourage shoppers to add more items to their cart.
  • Increase Price Per Item
    Drive value perception and upsell higher-priced options.
  • Reduce Friction to Spend More
    Remove barriers and make it easy to spend more.

Increase Items Per Order

Get customers to add more to their cart. Cross-sells, bundles, and “frequently bought together” recommendations all help.

Reducing friction also plays a big role through one-click add-ons, visible related products, and simple bundle builders.

The key metric here is items per order (IPO), not just AOV.

If the IPO is rising but AOV isn’t, it usually means customers are adding more low-value items. That’s a sign to improve what you’re recommending.


Increase Price per Item

Get customers to buy a more expensive version of what they’re already thinking about. Upsell with premium variants or improved versions with better features or materials.

Here, showing higher-priced options first, clearly communicating the value of premium tiers, and using guided selling tools all help.


Reduce Friction to Spend More

Sometimes the issue isn’t a lack of willingness to spend. It’s friction.

A complicated checkout. An unclear free shipping threshold. A payment method that feels risky for larger purchases.

Frictions like these can suppress AOV even when intent is high. Remove such frictions and watch AOV increase.

How to Increase Average Order Value: Proven Strategies

1 Personalization and AI-Driven Strategies

AI-Powered Product Recommendations

At a basic level, recommendations work by showing customers what they’re likely to buy next. But the real impact comes from relevance and timing.

AI recommenders such as Recommend™ use browsing behavior, past purchases, and real-time signals to recommend the right product at the right moment.

Manual rules don’t scale. You can’t hand-pick cross-sells for thousands of products. AI systems can. They learn continuously from what customers actually click and buy and improve over time without manual effort. And that’s how AI-driven recommendations increase average order value  in the long term.
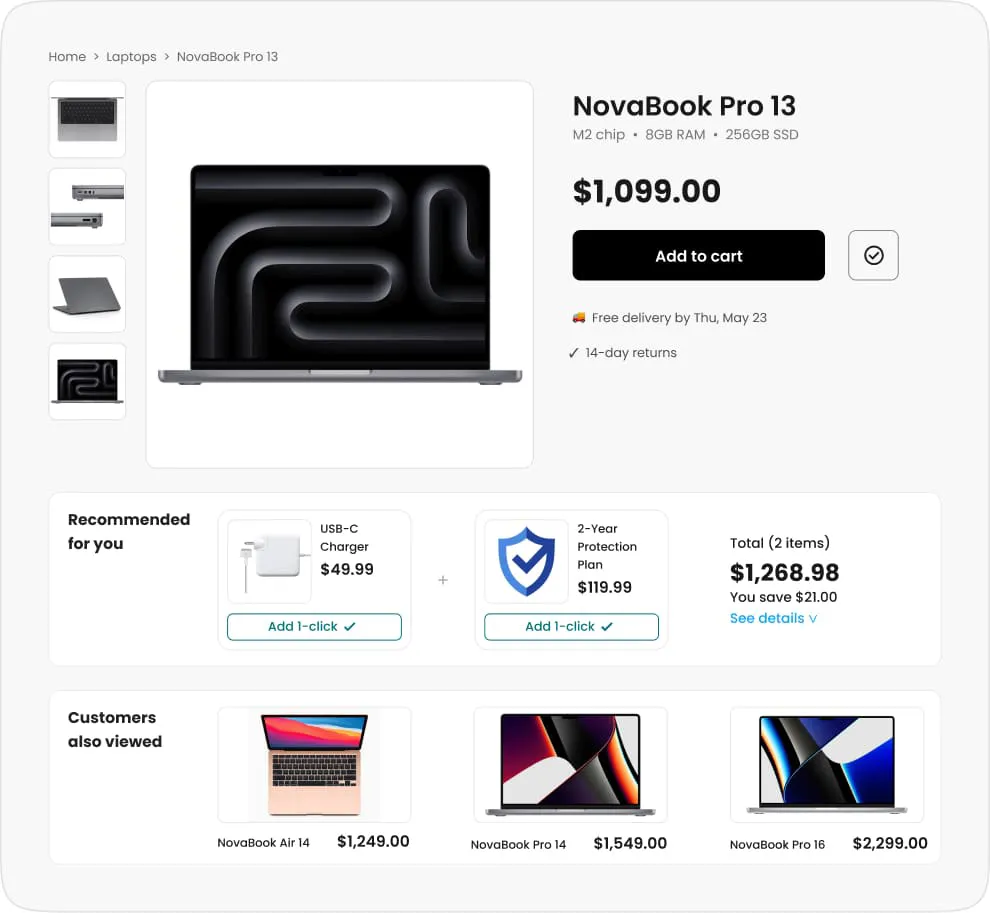
Placement matters just as much as the algorithm. Recommendations shown in the cart or at checkout tend to drive more AOV than those on product pages, simply because intent is higher at that stage.

For example, retailers using Recommend™ have seen measurable increases in items per order shortly after implementation. eXtra, Saudi Arabia’s largest electronics retailer, achieved a 52% higher AOV from AI-powered recommendations.

In some cases, AI-driven recommendations have driven significant AOV gains alongside improvements in engagement and conversion. A Brazilian beauty retailer that deployed Recommend™ alongside Find™ saw a 55% increase in AOV, a 4% conversion lift, and 3x session engagement.

See how Recommend™ can drive AOV growth for your ecommerce funnel, from PDP to checkout.

Request a Demo

Personalized Search

Search is where high-intent shoppers show up.

If someone is typing in your search bar, they already know what they want. Search’s role is not just to match keywords but to find the best product for that particular shopper.

Personalised search re-orders results based on behaviour. The customer who likes premium brands sees premium products first. Find™ does exactly this. It interprets intent, not just keywords, and personalises results from the very first interaction.

Better outcomes lead to more confident decisions and often higher-value purchases.

Search features that personalise results also create natural cross-sell and upsell opportunities.

When a shopper searching for a camera sees compatible accessories ranked alongside it, or a premium model surfaced above the standard version, the search experience itself becomes an AOV driver.

Explore how personalized search powered by Find™ can improve your search experience and drive higher-value purchases.

Request a Demo

Real-Time Personalization

Static experiences treat every visitor the same.

Real-time ecommerce personalization adjusts what each shopper sees, based on what they’re doing right now. That could be product recommendations, banners, or category rankings.

The more relevant the experience, the easier it is for customers to find what they want, and the more likely they are to spend more in a single session.

Behavioral sTargeting

Your customers tell you what they want with their actions.

Multiple product views, category exploration, and previous purchases are very good indicators. Behavioral targeting then leverages these signals to send timely nudges, reminders, relevant offers or possible follow-up recommendations.

You no longer hope that customers stumble across products; you meet them when they are expressing intent.

That’s what drives higher AOV.

See exactly where your AOV is leaving money on the table

If you raise AOV but fewer people convert, your revenue stays flat. RPV catches that. An RPV Lift Teardown with ADA Global pinpoints which pages, segments, and touchpoints are dragging down the RPV Lift. The best part? The analysis is absolutely free.

You’ll get:

  • Where AOV and RPV are leaking, by page and segment
  • Gaps in recommendations, search, and personalization
  • A focused 90-day plan to lift AOV, CVR, and RPV

Get Your RPV Lift Teardown

2 Cross-Selling and Upselling Strategies

Cross-selling and upselling are two of the most effective ways to increase AOV.

According to McKinsey, Amazon had even reported that up to 35% of its revenue was driven by cross-sell and recommendation systems.

Upselling moves customers to a higher-value version of what they’re already considering. Cross-selling adds complementary items to the basket.

Both depend on relevance. If the suggestions don’t fit, they get ignored, or worse, reduce trust.

Product Page Cross-Selling

“Frequently bought together” is one of the most familiar cross-sell formats and still one of the most effective when it’s based on real purchase data rather than manual curation.

On high-consideration product pages, it removes the need for customers to figure out what else they might need, and makes it easier to buy the complete set.

But remember: the key is specificity.

“Customers who bought this camera also bought this memory card and case” works. But “You might also like these cameras” is just confusing.

Cart-Level Cross-Selling

The cart is a high-intent moment for shoppers. They have already decided to buy, but they just haven’t checked out yet.

When you show one or two relevant, low-priced add-ons that are easy to add, customers are more likely to include them without feeling forced.

Less matters here. Too many suggestions create friction, as we’ve already seen above.

The suggestion that closes the threshold gap

Matas, Denmark’s largest health and beauty retailer, used Recommend™ to personalise cart-level cross-sells, resulting in a 38% increase in items sold via recommendations. We can do the same for your store.

Get a Demo

Post-Purchase Upselling

Post-purchase upselling is probably one of the most underestimated AOV tools available to retailers.

As soon as customers complete their purchase, once they reach the confirmation screen or receive their order confirmation email, the payment method is known, and they will be less resistant to further offers.
This stage is especially beneficial for subscriptions.

AI-driven post-purchase solutions take this further. Instead of showing a generic upsell on the confirmation page, platforms like Recommend™ use purchase signals and behavioural data to surface the most relevant add-on for that specific customer at that specific moment.

That relevance is what makes post-purchase one of the highest-converting placements for AOV growth.

3 Product Bundling Strategies

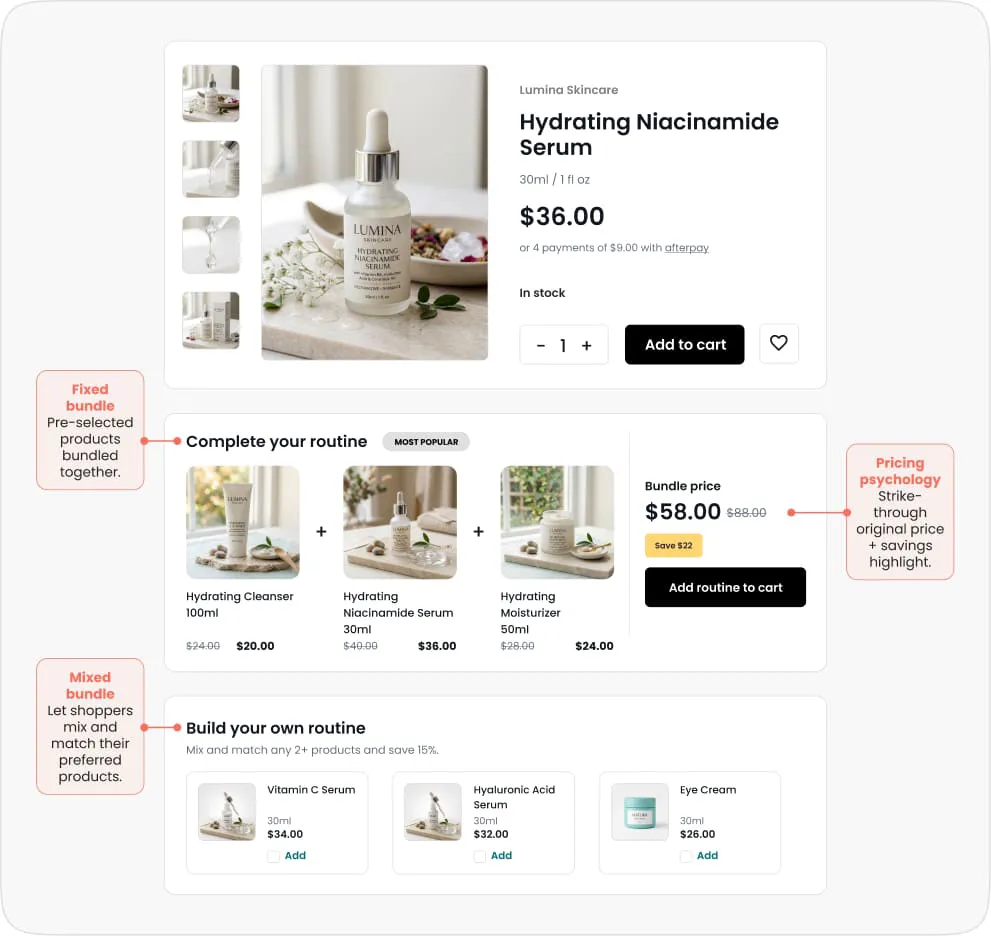
Bundles are one of the most effective ways to increase AOV. They typically drive a 20–30% lift, and customers who buy bundles tend to have much higher lifetime value than those who buy single items.

The reason is both practical and psychological. Bundles remove the need to make multiple small decisions and make it easier for customers to commit to a higher total spend.
Fixed Bundles

Pre-made bundles work best when the “right combination” is already obvious.

Imagine a skincare starter pack, a basic camera with a lens, or a coffee maker packaged with filters and coffee beans. It’s obvious that you get all you need without extra effort.

You’ll be surprised, but naming plays a crucial role here. As you can tell, “Complete skincare starter kit” obviously sounds much better than “3-item bundle”.

Mix-and-Match Bundles

Mix-and-match bundles offer customers some structure yet still allow them choices.

This approach works very effectively for products/services where customer preference is high; for instance, “Select any 3 flavours to enjoy a 20% discount” or “Create your own skin care regime”.

Herein lies the paradox.

Choice adds more friction to the process, resulting in lower conversion rates than with fixed bundles. However, once converted, the customer spends even more because they have crafted their own bundle.

AI-Based Bundles

This is where scale becomes a real advantage.

AI-driven bundles use actual purchase data to generate combinations that are more likely to convert. Instead of relying on manual curation, the system continuously learns which products work well together and updates in real time.

That’s why these bundles tend to outperform manually created ones. They’re always based on what customers are actually doing, not what we think they might do.

Platforms like Recommend™ go a step further by factoring in margin, so you’re not just increasing AOV but doing it profitably.

For retailers looking for dynamic bundling tools to increase average order value, Recommend™ is built specifically for this. It generates bundles from real co-purchase data, applies compatibility and margin rules, and updates automatically as buying behaviour changes without any manual curation.

Pricing Psychology in Bundle Presentation

How you present a bundle can make a big difference.

“Save $18” works better than “Bundle price $82” because the benefit is immediate. Customers shouldn’t have to do the math.

Customers find it much easier to see the value when the original prices are shown next to the bundle. It gives them something concrete to compare against and makes the savings feel more real.

Even small nudges can make a difference. A simple prompt like “Buy one more to unlock bundle pricing” is often enough to push them to complete the bundle.

Lift AOV with bundles that actually convert

Recommend™ combines shopper signals, compatibility rules, and margin logic to build winning bundles for your catalog.

Book a 30-minute demo

4 Pricing and Discount Strategies

Pricing and discounts can boost AOV quickly, but only if they’re structured correctly.

Volume Discounts

“Buy more, save more” works because it gives customers a clear reason to add one more item.

Tiered offers like “10% off 3 items, 15% off 5” create a simple progression. Once a customer is close to the next tier, they’re likely to push a bit further to unlock it.

That said, it’s easy to get this wrong. If your thresholds are too low or your discounts too aggressive, you’re just giving away margin on purchases that would have happened anyway. The goal is to ensure that the extra items more than offset the discount.

Tiered Pricing

While volume discounts push shoppers to buy more, tiered pricing encourages them to spend more on a single item.

A “good, better, best” setup makes comparison easy. When the price increase is small relative to the added value, the customer will naturally move up a tier.

This is where anchoring comes in. Showing a higher-priced option first makes the next option feel more reasonable, even if that’s where you wanted customers to land all along.

Limited-Time Offers

Another driver that works well is urgency.

When customers see a deadline, like “Only available until Sunday”, they’re more likely to act now instead of putting the decision off. And when they do act, they often complete a larger basket in the same session.

But this will only work if it’s genuine. If every offer is for “limited time,” customers stop believing it.

Coupon-Based Incentives on Spend Thresholds

Spend-based offers like “Spend $150 and get $20 off” combine urgency with a clear target.

It works best when the required spend is just a little higher than what the customer was already going to spend. It should feel easy to reach, but still require the customer to add something extra.

This is where segmentation helps. Loyal customers can stretch further, while new customers may need a lower threshold to engage. A single blanket offer rarely works as well as a tailored one.

5 Cart and Checkout Optimization

The cart and checkout are high-intent moments. A small change here can really help increase order value.
Free Shipping Threshold

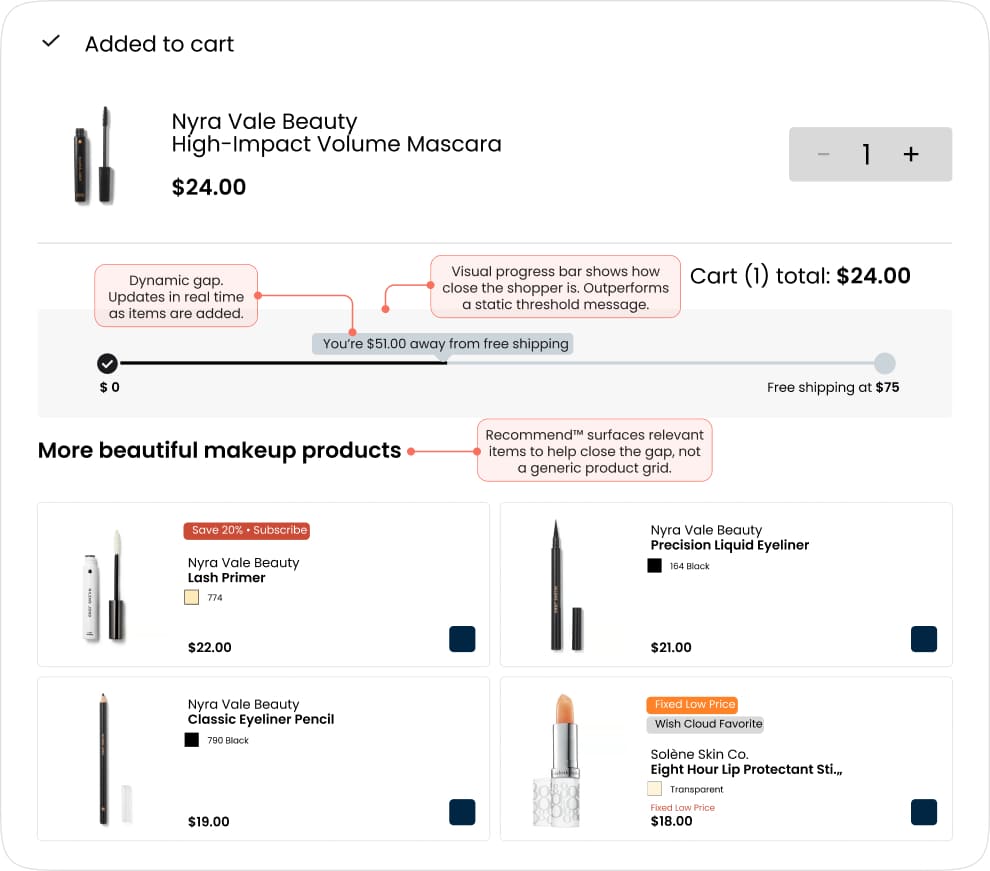
Research indicates that free shipping increases average order value in any business. In some cases, more than 50% of consumers have admitted to adding items to their shopping cart to take advantage of free shipping. In fact, free shipping can increase AOV by 15-30%.

Free shipping is one of the most reliable ways to increase AOV, because it directly changes how customers behave. In fact, 58% of shoppers add items to their cart specifically to qualify for free shipping (Deloitte), while 39% abandon checkout due to unexpected shipping costs (Statista).

That’s the balance you need to get right.

Some customers add more items to reach it. Others leave when they see shipping costs. So the goal is to set the right minimum spend.

That minimum should be slightly higher than what customers usually spend, just enough to nudge them to add one more item.

If it’s too low, you lose margin. If it’s too high, customers won’t try to reach it.  And the threshold should be updated over time as prices and behaviours change.

Cart Progress Indicators

A simple message like “You’re $12 away from free shipping” is more effective than just stating the threshold. It turns a passive condition into an actionable state.

Progress bars go one better, showing the shopper how close they are, especially on mobile.

But the real kicker is combining that with suggestions.

Just showing the gap isn’t nearly as effective as saying “Add this screen protector ($8) to unlock free shipping”.

Set your free shipping threshold and let Recommend™ surface the right product to close the gap.

See it in action

Cart Progress Indicators

What stops the customer from making additional purchases is friction.

A one-click add-on solves this problem by allowing users to add something valuable yet affordable to their cart with a single click.

This works best for things like accessories, warranties, consumables, or gift options, especially when they’re simple and don’t require extra decisions.

Reduce Checkout Friction

Sometimes, it isn’t weak cross-sell hindering AOV; it’s the checkout process itself.

Forms that seem too lengthy, surprise fees, or even vague policies may make consumers pause, especially when making large purchases.

A streamlined and straightforward checkout process that signals returns, security, and product reviews removes such hesitation.

6 Payment and Financing Strategies

Making higher-priced items feel easier to buy is one of the most effective ways to increase AOV. Let’s see a few strategies.
Buy Now, Pay Later (BNPL)

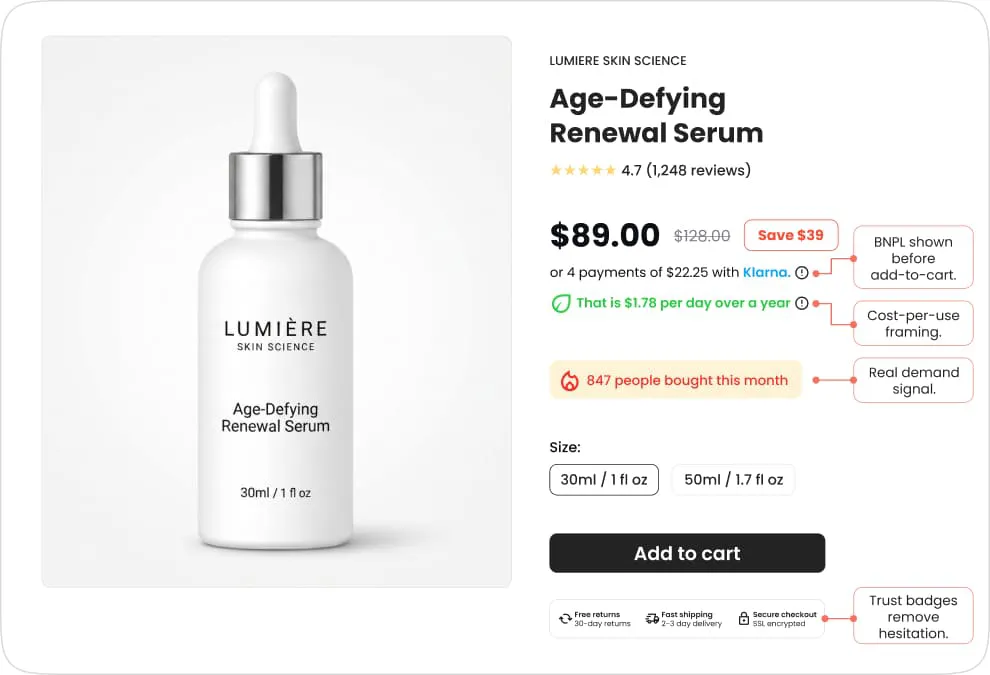
BNPL can increase AOV by making higher-priced items feel more affordable, especially across categories like beauty and fashion.

For example, instead of looking at an expensive item, a $480 sofa, the customer could look at a more palatable version, “of four payments of $120.”

That’s how BNPL consistently lifts AOV across categories.

Show Installments Early

Many retailers only show BNPL at checkout. This is too late.

To influence AOV, installment pricing needs to appear on the product page, before the add-to-cart decision, when customers are still deciding what they can afford.

Reduce Price Sensitivity

BNPL is one way to do this, but more importantly, it comes down to how you present the price.

Instead of focusing only on the total cost, break it down. Show cost per use, highlight long-term value, or make it clear what customers might spend over time if they choose a lower-quality option. These small shifts make higher-priced items easier to justify.

Social proof, such as demand signals, helps too. When customers see that others have bought and liked a higher-priced item, they’re more comfortable choosing it themselves.

The goal isn’t to make things cheaper. It’s to make the value clearer, so customers feel confident spending more.

Stop losing AOV at the decision moment

When shoppers hesitate on a higher-priced item, the right social proof signal closes the gap. Start with 1 to 2 trust and urgency widgets on your highest-value PDPs and see the difference in 30 days for free.

Start with SPM Quickstart

7 Loyalty and Retention Strategies

The customers you already have are often your biggest AOV opportunity. Let’s see how to capitalize them.

Loyalty Programs

Loyalty programs don’t just bring customers back; they also increase how much they spend.

Loyalty program members tend to spend more because rewards are tied to their purchases. It turns every buy into a quick decision, so adding one more item feels like the obvious choice.

That thinking consistently pushes order values higher.

Tiered Rewards

How you structure your loyalty program matters.

Tiered systems, like bronze, silver, and gold, give customers something to work toward. As they get closer to the next tier, they’re more likely to increase their spend to unlock it.

In practice, this works a lot like a personalized free shipping threshold. The closer customers are to the next level, the more likely they are to stretch their basket.

Subscription Models

Subscriptions build on an existing relationship.

Once a customer commits to a recurring purchase, the decision is already made. That makes it easier for them to add more items over time, especially complementary products.

You’re not just increasing repeat purchases, you’re increasing the value of each one.

VIP Customers

Your highest-spending customers should feel it.

The top 5–10% of your customer base often drives a disproportionate share of revenue. Giving them early access, better recommendations, or a more personalized experience signals that they’re valued.

And when customers feel valued, they tend to spend more.

8 Merchandising and UX Optimisation

AOV isn’t just about pricing; it’s about what you show and how you present it.

Product Placement

What you promote is what gets bought.

If your homepage, category pages, add-to-cart pages and emails mostly feature mid-range or lower-margin products, that’s what customers will gravitate toward.

On the other hand, consistently showcasing higher-value items helps customers get familiar with them and makes those price points feel normal.

For fashion ecommerce specifically, AOV lift often comes from outfit-based recommendations rather than individual product cross-sells.

Showing a complete look alongside a single item is consistently more effective than recommending another jacket. Recommend™ builds “complete the look” bundles using merchandising rules, making it one of the most direct tools for increasing AOV on fashion ecommerce websites.

High-Margin Products

Not all AOV gains are equal.

A $50 increase driven by a high-margin product is far more valuable than the same increase coming from a heavily discounted item. That’s why it’s important to be intentional about what you push.

Focus on products that have the right mix of margin, conversion potential, and cross-sell value, and make sure they show up in recommendations, bundles, and key placements across the site.

Anchor Pricing

The first price the customer sees influences all subsequent decisions.

When presenting the customer with a $500 item, anything priced at $200 will seem quite reasonable. On the other hand, when presenting the customer with a $200 item, anything above will seem quite costly.

That is precisely why starting with the high-end items works well; it creates a reference point, making everything else seem affordable.

Visual Merchandising

How a product looks affects how much customers are willing to pay for it.

Good images, descriptions, and context all create confidence, even more so when dealing with high-end products. Premium-looking products are more expensive for a reason.

The best recommendations will not work if the page on which they appear is not done well enough. It is as important as placement.

9 Psychological Triggers
Scarcity

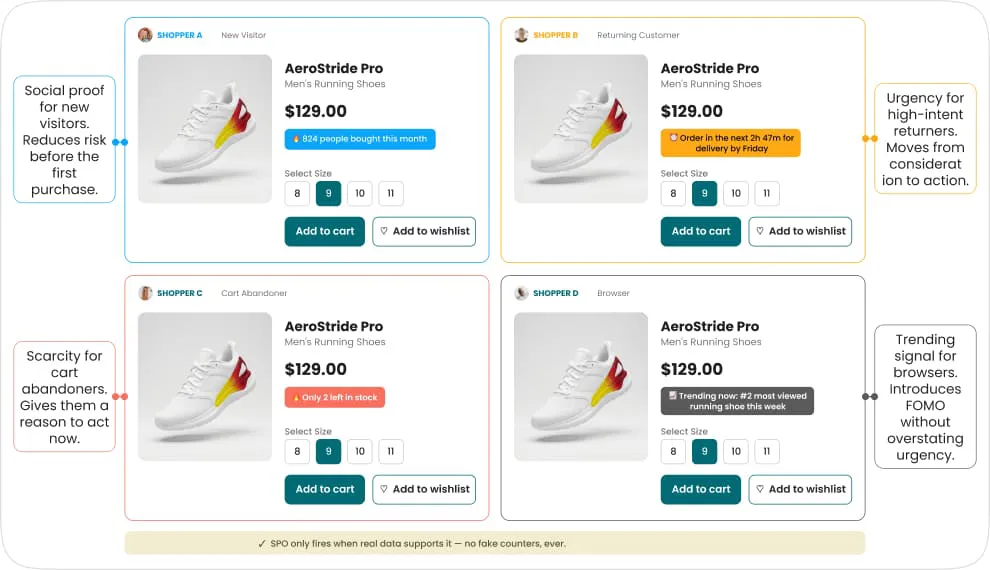
Or saying something like “Only 3 left in stock” works because it gives the customer a reason to act now.

People don’t want to miss out when something seems limited. This is especially true for higher-value items that people tend to buy more tentatively.

But it only works if it’s genuine. Trust disappears quickly if customers think it is manufactured.

Tools like Social Proof Optimize help here because they only show scarcity signals when the data actually supports them, keeping the message credible.

Social Proof

Social proof reduces the hesitation.

Reviews, ratings, or cues like “X people bought this today” make more expensive products feel safer to buy. It seems less risky if other people have bought it and been satisfied. This is especially important for products above a customer’s normal spend, where doubt is at its highest.

The problem is that most retailers send the same message to all shoppers. High-intent returning customers and first-time visitors need different things to feel confident.

Social Proof Optimize knows who’s looking, what they need to see at that moment, and selects the most likely-to-convert message for that visitor.

Urgency

Urgency moves people from thinking to doing.

Deadlines, countdowns or limited-time offers reduce the likelihood that a customer leaves and never comes back. And when they do decide to buy, they’re more likely to buy a larger basket at that moment. It works even better when combined with bundles or tiered offers.

Social Proof Optimize tracks purchase velocity in real time, so signals like “selling fast” or “trending now” are representative of what’s actually going on on your site, not a label someone set last quarter. It’s actually happening on your site, not a static label someone set last quarter.

Perceived Value

Sometimes the issue isn’t price, it’s clarity.

Customers don’t always see why a premium option is worth more. Clear product descriptions, comparisons, and strong visuals help bridge that gap. When a product looks and feels premium, it becomes much easier to justify the price.

Stop losing AOV at the decision moment

When shoppers hesitate on a higher-priced item, the right social proof signal closes the gap. Try SPM Quickstart free — 1 to 2 trust and urgency widgets on your highest-value PDPs, results in 30 days.

Get started free

A/B Testing Strategies to Improve AOV

What to Test

  • Pricing thresholds: Free shipping cutoffs, discount tiers, and bundle pricing. These have some of the largest AOV effects and are fast to test.
  • Bundle configurations: Fixed vs mix-and-match, bundle names, discount display format (“save $X” vs. “% off”), number of items per bundle.
  • Recommendation placements and formats: PDP widget vs below-the-fold; carousel vs grid; number of products shown; heading copy.
  • Checkout add-ons: Which products to surface, at what price points, with what copy.

Experiment Ideas

Run a threshold test: split your audience into three groups — the current free shipping threshold, a threshold set 15% above AOV, and a threshold set 25% above AOV. Monitor AOV, conversion rate, and RPV across all three for four weeks. The RPV winner, not the AOV winner alone, is the threshold to roll out.

Test upsell message framing: “Get the full-size version” vs. “Most shoppers who bought this went for the full-size” vs. “The full-size is $20 more and lasts twice as long”. These differences in framing often lead to 15-30% differences in conversion rates on the same underlying upsell.


Measuring Impact

As we’ve discussed before, AOV alone is a misleading success metric for most AOV experiments. The correct framework is:

  • AOV
  • Conversion rate
  • Revenue
per visitor
  • Gross margin
per order

Measure all four of them. A 12% lift in AOV but an 8% drop in conversion and a 5% drop in margin are not a win.


Scaling Winning Experiments

When an experiment wins clearly on RPV and margin, roll it out in stages rather than all at once — segment by segment (loyalty members first, then returning customers, then new visitors), or channel by channel. This gives you a safety net if there’s an interaction effect you didn’t catch in the test, and it gives you additional data on whether the lift holds across different customer types.

Common Mistakes That Hurt Average Order Value

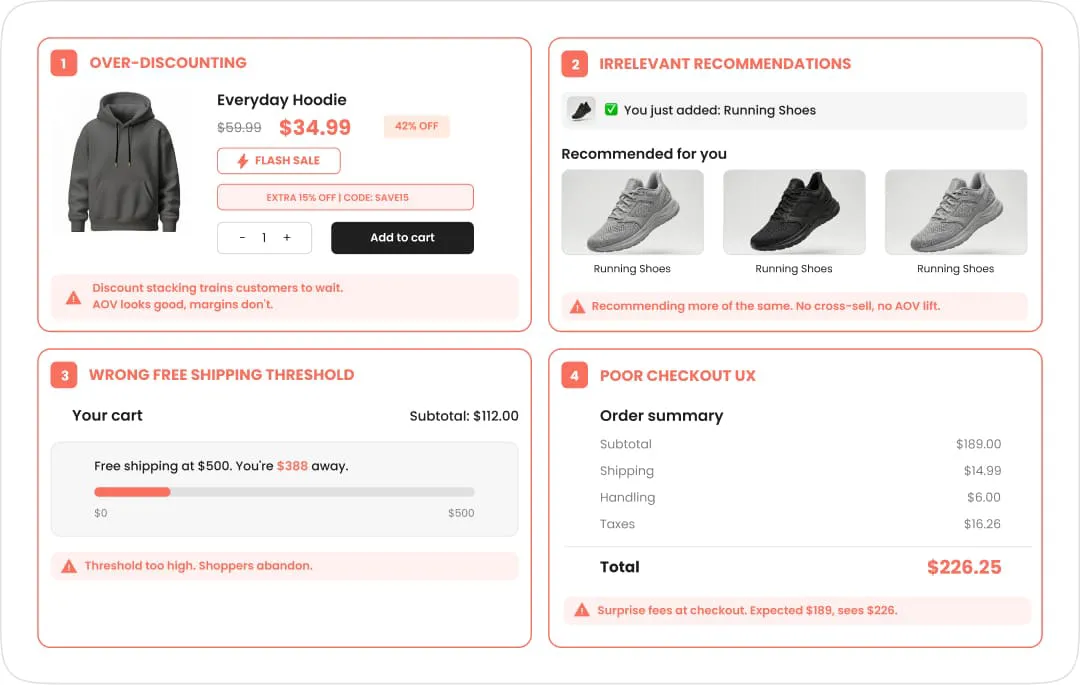
Over-Discounting

Discounts may temporarily increase AOV, but they are highly susceptible to overuse.

If consumers begin to expect a 20% discount, they will wait for it, or they may start perceiving the new reduced price as a price increase. This will eventually reduce your AOV and increase your growth costs.

Please be smart about how you implement discounts, and make sure they have an expiration date.


Irrelevant Recommendations

A “you might also like” widget showing completely unrelated products doesn’t just fail to convert, it actively undermines trust in your product curation.

Shoppers who see irrelevant suggestions conclude that your brand doesn’t understand their needs, and that contaminates the whole shopping experience.

Relevance quality matters more than volume. One precisely relevant suggestion outperforms five generic ones in every test.


Poor Checkout UX

A lengthy, confusing, or surprise-fee-laden checkout process suppresses completion on the high-AOV orders you most want to keep.

In the event of delays, complications, or unexpected costs during the process, customers tend to abandon their baskets, particularly when the cart value is high.

The process should be as straightforward as possible to facilitate the completion of expensive orders.


Wrong Free Shipping Threshold

Set it too low, and you’re giving away shipping on orders that would have happened anyway. Set it too high, and you’re creating a psychological barrier that triggers abandonment on otherwise convertible baskets.

It’s not something you set and forget. As your AOV changes, your threshold should adjust with it.
Measuring AOV Optimisation: Key Metrics to Track

Core Metrics

  • AOV trend (7-day, 28-day, quarter-over-quarter) tells you direction and velocity. A single week’s dip is noise; three consecutive weeks are a signal worth investigating.
  • Revenue per visitor is the holistic health check — it captures the interaction between AOV and conversion rate, so neither improves at the other’s expense.
  • Items per order is the most direct output of bundling and cross-sell programmes. Track this alongside AOV: if items per order rise but AOV doesn’t, recommendations are surfacing low-value items.

Leading Indicators

AOV is a trailing indicator. By the time AOV changes, the actions that led to the change have already occurred.

To do something sooner, you need to track the cues that precede it.

  • When customers don’t click on recommended items, it means there is an issue with relevance or placement, not AOV.
  • When cross-selling fails, the deal becomes less attractive.
  • When bundle pages are viewed but not bought, prices or messaging are wrong.
  • When people repeatedly fall short of the free shipping threshold, you know there is potential to tap into.

These are the cues that explain why AOV is what it is.


Margin Tracking

One thing matters more than AOV alone: profitability.

An increase in AOV doesn’t mean much if it’s driven by heavy discounts, stacked promotions, or a shift toward low-margin products.

Always track gross margin per order alongside AOV. Otherwise, you risk optimizing for a number that looks good but isn’t.

How AI and Personalization Are Transforming AOV

The gap between what personalization leaders achieve and what laggards achieve is wide and widening. BCG’s 2025 Personalization Index found leaders running at a CAGR 10 percentage points higher than laggards.

Real-time personalization — adjusting every surface of the experience based on live session behaviour, not just historical data — is where the biggest incremental lifts now live.

ADA Global’s platform connects search (Find™), product and content recommendations (Recommend™), social proof messaging (Social Proof Optimize) and omnichannel marketing (Active Content) to provide end-to-end AI personalization.

Global brands, including Abercrombie & Fitch and Tiffany & Co., use this infrastructure to personalize every touchpoint in real time.

Conclusion: Turning AOV into a Scalable Growth Engine

AOV growth doesn’t require more traffic. It requires doing more with the customers already buying from you.

The retailers achieving 52%+ AOV lifts haven’t found a single tactic. They’ve built a system where every touchpoint works together: AI recommendations surface the right product, personalised search gets shoppers to higher-value items faster, social proof closes the hesitation gap, and content personalisation makes the whole experience feel relevant from first click to checkout.

That’s what ADA Global is built for. Recommend™Find™Social Proof Optimize, and Active Content work as one connected layer, so each signal makes the others smarter. The result is AOV growth that compounds rather than plateaus.

ADA Global customers like eXtra have seen 52% higher AOV. See exactly where your revenue is slipping and get a 90-day plan to fix it.

See exactly where your AOV is 
leaving money on the table

Get Free RPV Teardown

Frequently Asked Questions

1 What is average order value?

Average order value is the mean amount customers spend per transaction: total revenue divided by the number of orders in a given period. It’s one of the three core ecommerce health metrics alongside conversion rate and revenue per visitor (RPV). Unlike conversion rate, which measures how many people buy, AOV measures how much those buyers spend — making it the primary lever for revenue growth without additional acquisition spend.

2 What is a good average order value?

There’s no single answer,as it depends on your vertical. Fashion averages $100 to $200, luxury $300+, beauty $60 to $90, and B2B can reach $500 to $1,000+. Global general retail sits around $145 (Shopify, 2026). The most useful benchmark is your own category measured against your own trend, not a global average.

3 How do you increase average order value?

The most effective strategies are AI-based product recommendations, product bundling, BNPL services, and proper optimization of the minimum purchase amount required for free shipping. Tiered loyalty programs with spending structures will always be effective ways to increase average revenue per user.

4 Does free shipping increase AOV?

Yes, when the threshold is set correctly. 58% of consumers actively add items to their cart to qualify for free shipping, and well-calibrated thresholds drive AOV improvements of 15–30%. The threshold should sit 15–25% above your current AOV. Too low and you’re giving away shipping on orders that would have happened anyway; too high and you push customers into abandonment.

5 Is AOV more important than conversion rate?

Neither is more important — they move together. Revenue per visitor (RPV = AOV × conversion rate) is the number that tells you whether you’re making net progress. An AOV improvement that comes at the cost of a steeper conversion drop is not an improvement. The goal is to raise both, or at minimum raise one without significantly hurting the other.

6 What tools help increase AOV?

ADA Global Recommend™, Find™, Social Proof Optimize, and Active Content are among the most powerful AI personalization platforms for increasing AOV. BNPL solutions like Klarna and Affirm allow customers to make bigger-ticket purchases. With GA4 and a CDP solution, you’ll know which segments are performing well at a glance.

7 What is AOV vs RPV?

Average Order Value (AOV) is simply revenue divided by the number of orders. Revenue Per Visitor (RPV), on the other hand, is calculated by dividing revenue by the number of visitors, regardless of whether those visitors made a purchase. RPV is a more robust metric because it combines purchase frequency and the number of purchases into a single metric. An increase in AOV of 15% paired with lower conversion rates from lower-quality traffic could lead to a reduction in RPV.

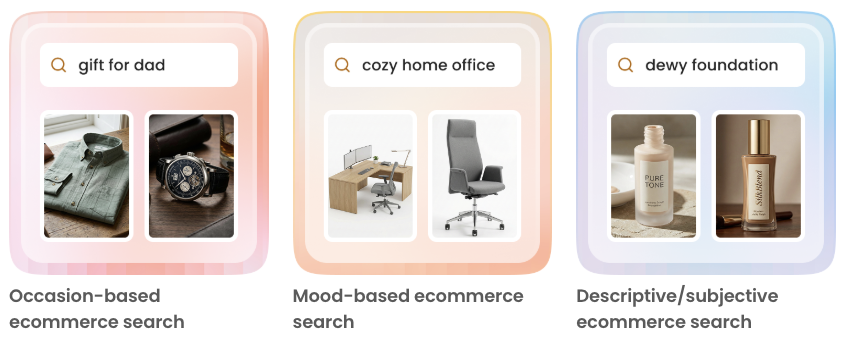
Table Of Contents
Key Takeaways on Increasing AOV
What is Average Order Value (AOV)?
Why Average Order Value is a Critical Ecommerce Metric
What is a Good Average Order Value?
How to Calculate and Track Average Order Value
The 3 Core Levers to Increase Average Order Value
How to Increase Average Order Value: Proven Strategies
A/B Testing Strategies to Improve AOV
Common Mistakes That Hurt Average Order Value
Measuring AOV Optimisation: Key Metrics to Track
How AI and Personalization Are Transforming AOV
Conclusion: Turning AOV into a Scalable Growth Engine
Frequently Asked Questions

Searching vs Finding: How to Fix the Findability Gap

Digital Experience Personalization
Blogs

Searching vs Finding: How to Fix the Findability Gap

Pulling customers to an ecommerce product site is a struggle, but converting those visitors into buyers is a battlefield. While dashboard metrics often paint a promising picture, the reality on the ground is defined by the cognitive load placed on the shopper. There is a critical threshold at which active discovery, the joy of finding, becomes manual labor, leading to ‘search fatigue’ and an immediate bounce.

Search is the first true 1:1 touchpoint between your brand and the consumer. It is the moment shoppers articulate demand in their own words. Yet, an experience that feels helpful in one moment can become disappointing the next. This happens because most ecommerce search engines still deliver static responses to shopper intent that is highly variable and context-driven. When platforms fail to adapt to this variability, a Findability Gap emerges.

The Findability Gap is the disconnect that occurs when a search engine fails to surface the right product, even when it exists in the catalog. Products remain hidden in plain sight, acquisition spend goes to waste, and trust erodes. Left unaddressed, this gap quietly increases discovery friction and inflates customer acquisition costs.

The modern B2C search journey is messy, not linear

Shoppers today do not search the way ecommerce search engines expect them to. Real-world ecommerce search behavior is rarely clean, precise, or sequential.

Instead, shoppers search in ways that reflect human thought:

These queries are often long-tail and context-heavy, stretching the limits of traditional engines built for structured input. Most search engines remain tuned for exact keyword matches and static relevance rules. They excel at matching data but fail when intent is emotional or unclear. The result is an experience that is technically relevant yet experientially unsatisfying.

Traditional search thinking assumes intent is fixed when a search engine receives a query. In reality, intent unfolds as shoppers interact with results—clicking, refining, scrolling, and comparing. When search fails to adapt to this messy human behavior, discovery becomes effortful instead of intuitive.

Why traditional search metrics miss the point

Most B2C marketers evaluate performance using a familiar set of KPIs:

  • Search Usage: The volume of visitors interacting with the search bar.
  • Search-Assisted Revenue: Total revenue from sessions where search was used.
  • Zero-Result Rate: How often a query returns nothing.
  • Top Queries: The most frequent search terms.

While these KPIs confirm outcomes, they are blind to discovery quality.

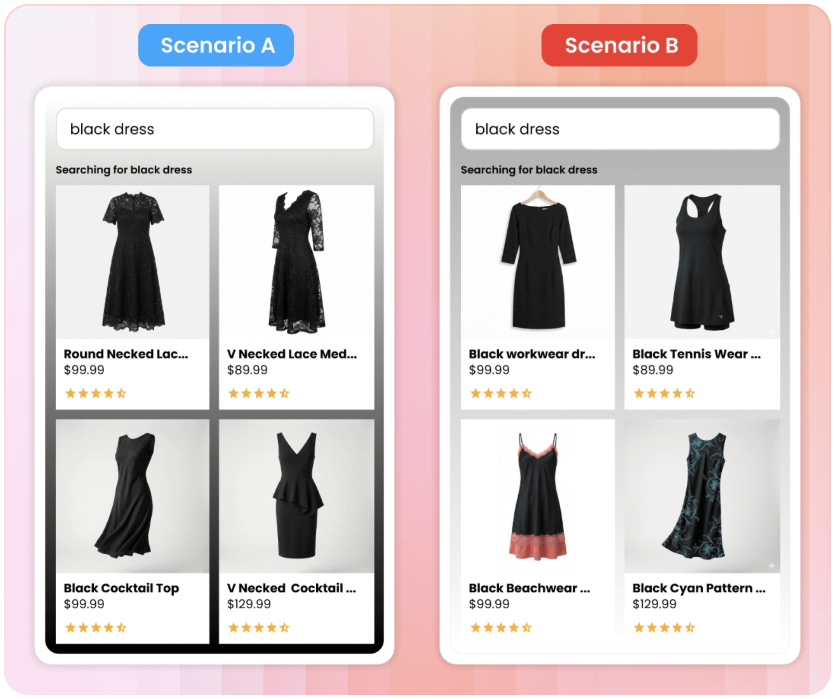
Consider a shopper looking for a “black dress” on a fashion retailer’s site:

Scenario A: The search engine recognizes her past affinity for luxury brands and evening wear. She sees a relevant ‘lace midi dress’ as the first result, clicks on it, and adds it to the cart within seconds.

Scenario B: Shopper struggles with a context-blind search engine. Because the system cannot detect in-session affinity, it fails to prioritize her specific need for formal wear, resulting in suggestions from a wide range of categories, making this a high-effort journey marked by manual filtering and ‘search fatigue’.

The ecommerce dashboard reality is misleading. On paper, these sessions look identical as both recorded a “Conversion” and “Search-Assisted Revenue.” But in reality, the dashboard is blind to the logic behind the scrolls.

In our example, scenario A gives the shopper a gratifying experience. In Scenario B, the shopper – if they convert – will do so despite the search engine. Traditional metrics reward the conversion but ignore the nudge, the hidden effort that erodes long-term loyalty.

This is where Findability failures hide.

Defining Findability in plain language

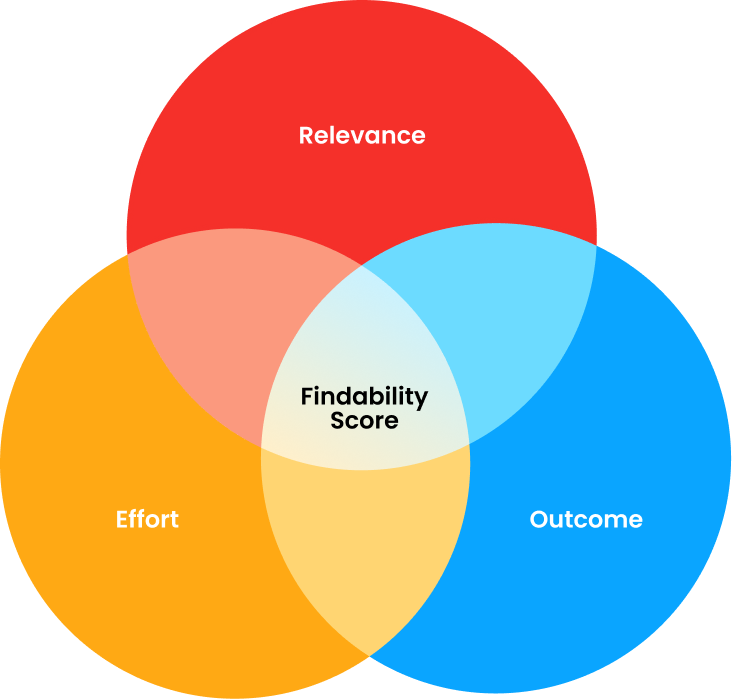
Findability puts shopper intent in focus. It is defined by how quickly and confidently a shopper moves from intent to the right product. We measure this through three core parameters:

Relevance
Do results align with intent, context, and real-time behavioral signals?

Effort
How much labor did the shopper exert? (Measured by clicks, refinements, and backtracking).

Outcome
Did the shopper engage meaningfully with a relevant Product Detail Page (PDP)?

Together, these form the Findability Score. Unlike traditional KPIs, this score makes discovery friction visible. It enables merchandising and CX teams to align around a single number that reveals exactly where the catalog is “leaking” revenue due to poor discovery.

A practical Findability scorecard for B2C teams

Findability does not require rebuilding your ecommerce search engine from scratch or running a complex data science project. It can be operationalized using ecommerce site search metrics that most teams already track or view on their sites, but through a different lens.

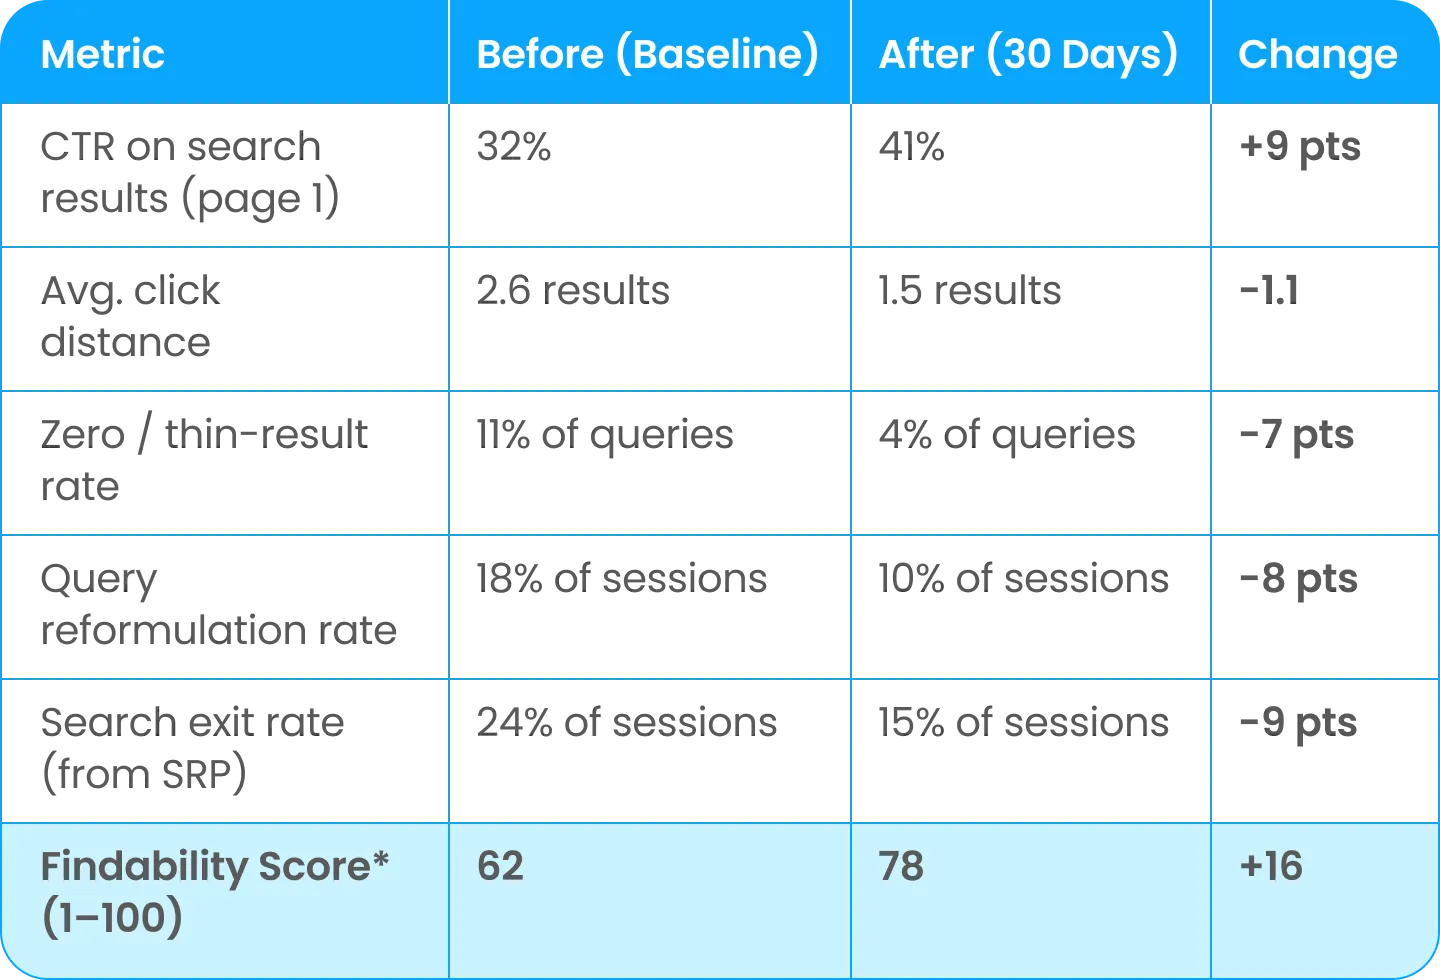
A practical findability scorecard might include (and not be limited to) the following:

  • CTR on search results
    (the percentage of searches where a shopper clicks on at least one search result)
  • Average click distance
    (how far down the list a shopper typically has to go before they click a product from the results)
  • Zero- and thin-result rates
    (how often your search engine fails to show enough reasonable options)
  • Query reformulation rate
    (the percentage of search sessions where shoppers quickly change or retype their query after seeing the results)
  • Search exit rate
    (the percentage of search sessions that basically end on the Search Results Page (SRP) without meaningful engagement)

Sample Findability Scorecard – “Women’s Dresses”

*This numeric scorecard is a conceptual example.

Individually, ecommerce site search metrics signal friction. Together, these metrics paint a clear picture of whether the ecommerce site search is helping or hindering discovery. When tracked consistently, these signals often reveal opportunities for improvement that deliver measurable impact within weeks, not quarters.

Teams can roll these signals into a simple Findability Score by category, brand, or key query group, creating one number to rally around. The goal is not perfection; instead, clarity: knowing exactly where shoppers struggle and where improvements matter most. In a nutshell, how shoppers search on an ecommerce site.

Closing the Gap with Find™

Overcoming the Findability Gap is less about adding features and more about aligning search with real shopper behavior. Find™ addresses this by transforming search from a static utility into a dynamic personalization surface through four key levers:

Natural Language Understanding
It bridges the gap between internal catalog jargon and shopper language by auto-learning synonyms and intent (e.g., recognizing that “best shoes for standing all day” requires comfort-rated attributes).

Behavioral Ranking
Instead of static rules, Find™ uses self-learning AI to rank results based on real-time affinities and in-session behavior, significantly reducing “click distance.”

Findability Analytics
It provides a dedicated lens into the Findability™ Score, allowing teams to move beyond “search volume” and pinpoint precisely where shoppers are struggling.

Real-Time Catalog Freshness
Ensures that pricing and availability stay in sync, so shoppers never find a product only to realize it is out of stock.

Conclusion: From search activity to shopper success

B2C brands have historically optimized for how often shoppers search; the next competitive advantage lies in how easily shoppers can find them.

Traditional metrics tell you what happened, but Findability tells you how it felt. By shifting focus to a shopper-centric metric that reflects effort and confidence, brands can stop forcing customers to work for their purchases.

Find™ brings these elements together—combining self-learning AI with behavioral intelligence to ensure that every search is a direct path to discovery, not a battlefield of frustration.

Ready to move beyond vanity search metrics? See how Findability changes the conversation.

Talk to Us About Find™
Table Of Contents
The modern B2C search journey is messy, not linear
Why traditional search metrics miss the point
Defining Findability in plain language
A practical Findability scorecard for B2C teams
Closing the Gap with Find™
Conclusion: From search activity to shopper success

Understanding Total Cost of Messaging Ownership for Better ROI

Personalisation
Blogs

Understanding Total Cost of Messaging Ownership for Better ROI

Total Cost of Messaging Ownership: The Real Measure of Value in Business Messaging

Organisations tend to struggle with balancing the cost and effectiveness of their business messaging.

Now, procurement teams often find themselves comparing price-per-message rates or platform fees, only to realise later that these numbers do not reflect the true value or impact of their communication systems. Hidden inefficiencies, fragmented vendor management, and compliance risks can quietly offset what initially seems like cost savings. This gap has widened because business messaging is no longer a simple volume game, but now involves technology integrations, AI-driven customer journeys, and more complex operational requirements that introduce costs far beyond the message rate itself.

This is more than a budgeting issue. Business messaging plays a direct role in how customers experience a brand, how efficiently teams operate, and how reliably compliance is maintained. When messaging systems are evaluated correctly, they can become a strategic advantage that improves customer engagement, strengthens trust, and drives measurable returns. When handled poorly, however, even small inefficiencies can scale into significant operational and reputational costs.

For example, implementing a CPaaS (Communications Platform as a Service) solution typically means integrating it with your marketing automation, CRM, and billing systems, where each one adds its own integration cost well before the first customer interaction even happens.

To avoid these challenges, procurement leaders need a more complete view of messaging performance. When evaluations focus only on unit costs, it becomes difficult to see how communication systems influence wider business outcomes. This narrow approach often leads to short-term savings but long-term inefficiencies. And importantly, these inefficiencies can be felt immediately, not sometime in the future, thus making it critical for procurement teams to eliminate surprises and gain full visibility upfront. Staying informed through expert insights and modern evaluation methods is crucial for maintaining the optimal balance between cost, compliance, and return on investment.

True cost efficiency lies not only in reducing expenses but in understanding how each conversation contributes to business results. The Total Cost of Messaging Ownership (TCMO) framework provides this broader perspective, connecting cost, ROI, and compliance to reveal the real value behind every interaction.

Understanding Total Cost of Ownership (TCO)

TCO is a framework that encourages organisations to look beyond the initial purchase price and consider the full cost of an investment over its entire lifecycle. This includes usage, maintenance, training, upgrades, and eventual replacement. By viewing ownership through this wider lens, businesses gain a clearer understanding of the true financial impact of their decisions.

The goal of TCO is to help organisations see the complete picture rather than rely on what appears to be the lowest-cost option today. This mindset leads to decisions that are more sustainable, efficient, and aligned with long-term growth.

This same principle applies directly to business messaging. The Total Cost of Messaging Ownership (TCMO) framework extends TCO thinking and reveals the full financial and operational implications of running messaging at scale.

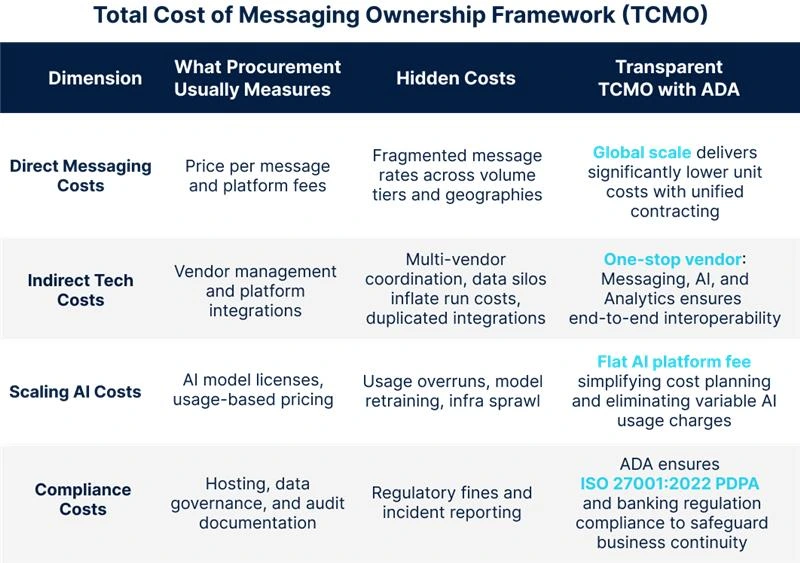
Traditional cost assessments tend to focus on the most visible expenses, such as message rates or platform fees. While important, these reflect only one part of the investment. The TCMO framework expands this view with four key dimensions that together define the real cost of business messaging.

Direct Messaging Costs

Direct messaging costs refer to measurable expenses like price per message and platform fees. These are often simple to calculate, yet they can become fragmented across regions, channels, and vendors. When organisations consolidate their messaging through a unified, global solution, contracting becomes more consistent and per-unit costs often decrease, creating a more manageable and predictable cost structure.

Indirect Tech Costs

Indirect tech costs arise from managing vendors, integrations, and ongoing technical support. These costs are frequently overlooked because they are spread across multiple teams and systems. Challenges such as coordinating different providers, duplicated integrations, or siloed data can inflate operational overhead. Using a single, integrated ecosystem for messaging, technology, and analytics reduces these inefficiencies and supports smoother day-to-day operations.

Scaling AI Costs

As organisations adopt AI to personalise experiences and automate journeys, the cost of scaling AI becomes increasingly important. Beyond AI model licences and usage-based pricing, hidden costs can arise through usage overruns, model retraining, or infrastructure sprawl. A unified AI platform helps simplify cost planning by providing predictable pricing and eliminating unexpected surcharges, making AI adoption more controlled and cost-effective.

Compliance Costs

Compliance costs relate to safeguarding data, meeting regulatory obligations, and ensuring proper reporting when incidents occur. In addition to hosting and data governance, organisations face the risk of fines, downtime, or audit-related disruptions. A messaging framework built on recognised certifications and regional regulations reduces this risk and helps maintain business continuity in environments where compliance expectations are high.

When these four dimensions are viewed together, procurement teams gain a more comprehensive understanding of their messaging ecosystem. The TCMO framework helps leaders look beyond surface-level cost comparisons and focus on how messaging contributes to both financial efficiency and business performance.

Procurement shouldn’t only measure the cost of messages but also the return generated from conversations. This perspective encourages organisations to uncover hidden costs early, prevent inefficiencies from scaling, and reinvest savings into areas that deliver long-term value. By applying the TCMO framework, leaders can ensure that every interaction contributes meaningfully to business objectives.

To put this into practice, organisations can start by assessing how they perform across these four dimensions. With tools such as the industry-specific TCMO Benchmark and ROI Simulation, procurement teams gain the clarity needed to make confident, evidence-based decisions and ensure nothing in their messaging strategy is overlooked.

Conclusion

The cost of business messaging should never be viewed in isolation. It is not simply about cutting costs but about uncovering how every interaction contributes to brand trust, customer satisfaction, and long-term business growth. By adopting a Total Cost of Messaging Ownership mindset, organisations can transform their business messaging from a basic operational expense into a measurable source of strategic value.

ADA’s trusted communication solutions help organisations eliminate hidden costs, simplify integrations, and gain instant clarity across their messaging ecosystem. With deep expertise in TCMO and a proven approach to uncovering real-world savings, ADA ensures businesses stay compliant, efficient, and fully in control.‍

If your organisation is ready to rethink its business messaging strategy, contact ADA today to discover how their proven services can help you build a messaging ecosystem that drives measurable results and lasting value.

Table Of Contents
Total Cost of Messaging Ownership: The Real Measure of Value in Business Messaging
Understanding Total Cost of Ownership (TCO)
Conclusion

One API to Authenticate Them All: The Future of Frictionless Authentication with ADA Verify

Personalisation
Blogs

One API to Authenticate Them All: The Future of Frictionless Authentication with ADA Verify

Digital services require users to verify their identity at many points, whether logging in, recovering an account, completing a payment, or accessing sensitive information. These checks are important for security, but common methods often introduce friction.

OTPs sent through SMS or voice can be delayed, fail to deliver, or be exposed to manipulation. According to industry security guidance, such as the NCSC, SMS has increasingly become a weak link due to SIM swapping, social engineering, and vulnerabilities in telecom signalling protocols. Regulations are also changing, increasing the pressure on organisations to stay compliant. Meanwhile, users expect quick, smooth access and may drop off when the process feels slow or complicated.

Organisations face the same strain. High verification drop-offs reduce conversions, weaken satisfaction, and affect long-term engagement. Managing traditional OTP systems requires fraud protection, routing management, compliance work, and number pool maintenance, creating additional cost and complexity. These efforts become even harder as SMS delivery costs rise globally and carrier filtering grows stricter, issues highlighted across multiple industry analyses discussing the hidden cost of SMS OTPs.

These challenges have pushed many organisations to explore frictionless authentication, a modern approach that securely verifies identity in the background while reducing interruptions. The goal is to simplify the experience without compromising security.

This is the purpose of ADA Verify. It streamlines authentication by offering one API that supports intelligent, unified verification across channels, removing the need to manage multiple vendors or fragmented systems.

What Is Frictionless Authentication?

Frictionless authentication validates identity quietly in the background, reducing manual steps such as entering passcodes. It aligns with modern identity systems designed to provide stronger security and a faster, easier experience for users.

The Problem with the “Old” Standard

Traditional authentication methods, especially SMS OTPs and password-heavy flows, have become one of the biggest friction points in today’s digital journeys. Every added step slows users down, and multi-step authentication is still a major driver of drop-offs, with abandonment rates often reaching around 30% during sign-up or checkout.

Passwords remain one of the most painful parts of the experience. Nearly 7 in 10 people struggle to remember them, and 40% use more than 11 passwords across their daily digital life. This constant password fatigue adds friction, slows down onboarding, and erodes trust in the process.

When authentication feels like work, users leave. When it feels seamless, they stay, and they convert. This is exactly why the old OTP-only standard struggles to meet the expectations of today’s digital consumer.

‍The Friction Factor

According to Martechvibe, 60% of Users Abandon Transactions Due To Authentication Frustration. Every extra moment in a digital journey affects conversion. Multi-step authentication often causes noticeable user drop-off during registration or checkout. In today’s competitive market, losing a meaningful portion of potential customers right at the start is far from ideal.

The Cost of Fragmentation

From a product and engineering perspective, things aren’t any easier. Supporting global authentication often means dealing with a patchwork of vendors, one SMS provider for Southeast Asia, another for WhatsApp worldwide, and a few more for smaller regions. This kind of fragmentation creates integration headaches, inconsistent data, and higher costs due to inefficient routing and failover setups.

How ADA Verify Redefines the Standard

ADA Verify does not replace an SMS gateway. Instead, it enhances your identity systems by offering one API that supports silent verification, intelligent fallback, and AI-driven routing. It acts as an orchestration layer that balances speed, security, and user experience.

ADA Verify evaluates every authentication attempt in real time to determine the fastest and most secure path available.

1 The “Seamless” First Step: Zero-Friction Authentication

When a user begins authentication, ADA Verify first tries carrier-based verification using secure mobile network operator connections. This background cryptographic check uses the mobile data network.

No input needed, no switching apps, and no OTPs exposed to interception. The process is instant, allowing users to log in effortlessly.

2 Intelligent Fallback and Orchestration

If silent verification cannot be completed, ADA Verify activates an intelligent fallback process. Instead of defaulting to SMS, it compares channels such as WhatsApp, SMS, Telegram, or Viber based on:

  • Enterprise preferences
  • User behaviour and preferred channels
  • Regional communication patterns

This ensures the most reliable and familiar method is used for each user.

3 Powered by AI-Driven Decisioning

At the heart of ADA Verify is ADA’s proprietary AI-driven orchestration engine, the “brain” that keeps everything running smartly. Static routing rules break when carrier routes change or when networks experience downtime. ADA’s engine is dynamic, continuously learning from millions of authentication attempts.

It analyses real-time signals, including delivery success rates, latency metrics, and conversion data. This continuous loop allows the engine to predict the optimal path for every attempt, resulting in delivery success rates that consistently exceed 90%, a figure traditional providers struggle to match.

Industries That Benefit From Frictionless Authentication

A wide range of sectors gain measurable value from reducing verification friction:

1 Financial Services

Banks, fintechs, and payment providers rely heavily on secure digital identity. Faster authentication reduces drop-offs during sign-ups, transaction approvals, and account recovery.

2 E-commerce

Retailers and marketplaces use frictionless authentication to reduce cart abandonment and protect against fraudulent purchases, while keeping the buying journey smooth.

3 Telecommunications

Mobile network operators play a dual role in digital identity: they are both providers of the underlying technology and end-users of authentication solutions. By enabling or adopting frictionless verification, they can reduce fraud, strengthen customer trust, and unlock new identity-driven revenue opportunities.

4 Healthcare

Online portals, telehealth systems, and patient records require secure but accessible authentication to ensure both safety and usability.

5 Travel and Mobility

Ride-hailing, ticketing, and booking services benefit from less friction during account creation and high-risk transactions.

6 Digital Services and Apps

Any service with frequent logins or content access controls can achieve higher retention when identity checks run smoothly in the background.

Beyond Authentication: The Future of Digital Identity

Digital identity is shifting from manual, user-driven actions toward background verification supported by secure networks and authenticated devices. Several trends are shaping the future:

  • Security remains a top priority, especially for sectors dealing with transactions or sensitive data.
  • User experience is increasingly important, as businesses link friction to customer churn.
  • Passwordless systems are becoming more widely adopted, using biometrics, passkeys, and encrypted device-based verification.
  • Telecommunications providers are expected to strengthen their role in authentication, using their network visibility to deliver secure digital identity services.
  • Multi-channel verification continues to evolve, ensuring reliable backup methods when silent checks are not possible.

Organisations are moving toward identity systems that work anywhere, anytime, with minimal disruption to the user.

Potential Extensions in Frictionless Authentication

ADA Verify isn’t just solving today’s authentication challenges, it’s laying the groundwork for a complete Digital Identity Assurance Layer. Our roadmap looks beyond verification alone and tackles the wider set of identity challenges that businesses face.

Here’s what’s coming next:

  • KYC & SIM Swap Verification
    In future releases, we’ll tap into telco connections to enable real-time SIM Swap detection. Verify not just the device, but the actual identity behind the number. Prevent impersonation and account takeovers.
  • Risk Scoring
    Evaluate user trustworthiness based on behaviour, device patterns, and network signals.
  • Persistent User Identity
    We’re also working toward helping enterprises unify identity data across devices so the user on an Android phone and the same user on an iPad are recognized as one high-value customer.
    As digital identity continues to evolve, ADA Verify provides a scalable, modern foundation that can grow with new use cases and future telco-driven features.

Conclusion: A Strategic Advantage for Real Business Growth

Upgrading your authentication system isn’t just a technical move, it’s a strategic one. Customers expect every digital interaction to be fast, effortless, and secure, and frictionless authentication is how organisations meet those expectations. By reducing reliance on OTP-only methods and introducing silent, real-time checks, businesses can deliver smoother experiences, strengthen fraud prevention, and minimise operational strain. Industry studies make this clear: authentication is no longer just a security issue, it is a customer experience issue, directly tied to loyalty, abandonment rates, and brand trust.

ADA Verify brings all of this together in one unified solution. It gives modern businesses what they truly need: a single API that authenticates users seamlessly, without the friction, complexity, or hidden costs of traditional OTP systems. With Verify, you unlock easier onboarding, higher conversions, stronger security measures, and a scalable foundation for long-term digital growth.

Contact ADA today to integrate ADA Verify and turn your authentication process into a real competitive advantage.

Table Of Contents
What Is Frictionless Authentication?
The Problem with the “Old” Standard
How ADA Verify Redefines the Standard
Industries That Benefit From Frictionless Authentication
Beyond Authentication: The Future of Digital Identity
Conclusion: A Strategic Advantage for Real Business Growth

Predictive Analytics in Ecommerce: A Complete Guide 2026

Data & AI
Blogs

Predictive Analytics in Ecommerce: A Complete Guide 2026

Every year, ecommerce brands lose millions from stockouts and wasted discounts. What if you could predict what your customers want, months before they even know it themselves?

Predictive analytics has emerged as the compass that helps businesses anticipate what customers want, when they’ll want it, and how best to deliver it. This shift from reactive to proactive strategies is reshaping the industry. Where merchants once relied on historical data to explain what already happened, predictive analytics now uses AI-driven models to reveal what’s about to happen. That difference translates directly into sharper campaigns, optimised resources, and more satisfied customers.

In this article, we explore the models, applications, and future trends of predictive analytics in ecommerce, providing a practical guide for retailers aiming to achieve sustainable growth and digital transformation.

What is Predictive Analytics in Ecommerce?

At its core, predictive analytics applies data, statistical models, and machine learning to forecast outcomes and behaviours. Unlike descriptive analytics (which explains what happened), predictive analytics tells you what is likely to happen next and what you should do about it.

It works by combining structured data (trends such as sales records, pricing, and inventory levels) with unstructured signals (customer reviews, social sentiment, browsing behaviour). Together, these streams create foresight that drives everything from smarter promotions to optimised supply chains.

The explosion of big data from omnichannel shopping habits to real-time competitor signals simply means predictive analytics is no longer reserved for tech giants like Amazon or Netflix. Today, even mid-sized ecommerce brands can harness these tools to stay competitive.

Why Ecommerce Retailers Can’t Afford to Ignore Predictive Analytics

Relying on gut instinct or outdated systems is no longer viable in today’s hyper-competitive market. Predictive analytics empowers retailers to make faster, data-driven decisions that prevent costly mistakes and capture emerging opportunities in real time. The risks of sticking with legacy systems or intuition-driven planning are severe:

  • Overstocking and waste
    Seasonal lines that don’t sell fast enough tie up working capital and end in heavy markdowns.
  • Stockouts and lost sales
    Customers don’t forgive “out of stock” notices. Each missed sale erodes loyalty.
  • Inefficient promotions
    Blind discounting inflates customer acquisition costs (CAC) without lifting retention.
  • Slow reaction times
    By the time manual reports reveal a trend, competitors have already moved.

How Predictive Analytics Works: Key Models and Data Sources

To unlock the full potential of predictive analytics in eCommerce, it’s essential to understand the models and data that make it work. While the technical details can be complex, the practical takeaway is clear: the right models, powered by clean data, translate directly into smarter business decisions.

1 Key Models in Practice

  • Time-Series Forecasting
    Models such as ARIMA, Prophet, or LSTM analyze historical sales patterns to anticipate seasonal peaks, promotional surges, or abrupt shifts in buying behavior.
  • Regression Models
    These models extend beyond sales data, incorporating external variables such as competitor pricing, marketing campaign performance, and even weather conditions. The outcome is a holistic view of the factors driving demand and conversions.
  • Hierarchical Forecasting
    Particularly valuable for retailers managing extensive SKU portfolios, this approach ensures that SKU-level predictions align with broader category-level objectives, maintaining both accuracy and strategic consistency.

2 Data Streams: Structured and Unstructured

Predictive analytics relies on two complementary data streams:

  • Structured Data
    This includes quantifiable information such as sales history, pricing, promotions, and inventory levels. Structured data forms the backbone of demand forecasting and stock management.
  • Unstructured Data
    Sources such as customer reviews, social media sentiment, influencer activity, and behavioral signals (e.g., browsing habits or cart abandonment) provide critical context. These insights reveal customer intent and shape purchasing decisions in ways structured data alone cannot capture.

Taken together, structured and unstructured data streams offer not only predictive forecasts but also the contextual “why” behind consumer behavior, enabling retailers to act with precision and confidence.

Putting Predictive Analytics into Practice

Understanding the theoretical foundations of predictive analytics is only the first step; the real value lies in its application across day-to-day eCommerce operations. The following use cases illustrate how predictive models can be embedded into core business processes to drive measurable outcomes.

1 Demand Forecasting

A fashion retailer uses LSTM time-series models to predict demand for seasonal collections. Instead of overstocking winter jackets, the brand aligns inventory levels with predicted spikes in colder regions, minimizing excess stock while meeting local demand.

2 Dynamic Pricing

An electronics store monitors competitor pricing and customer demand in real time. Predictive regression models adjust product prices daily, balancing profit margins with competitiveness. This enables the brand to capture sales during major promotional events such as Singles’ Day or Black Friday without eroding margins.

3 Personalised Recommendations

An online beauty brand uses session-based collaborative filtering to recommend products. If a customer browses moisturizers but leaves without purchasing, the system predicts purchase intent and later recommends a customised bundle (e.g., moisturizer and serum) via email. This strategy increases both conversion rates and average order value.

4 Churn Prevention

A subscription-based meal delivery service identifies customers at risk of cancellation by analyzing patterns such as reduced logins, skipped orders, or declining engagement. Predictive churn models trigger automated retention offers such as discounts or personalised meal plans before the customer makes the decision to leave.

5 Inventory Optimisation

A global marketplace predicts SKU-level demand across multiple regions. Hierarchical forecasting reconciles category-level predictions with local buying behavior, ensuring warehouses are stocked strategically. This reduces costly cross-border shipping and accelerates delivery times.

How Amazon Uses Predictive Analytics

Amazon faces one of the most complex forecasting challenges in the world, predicting demand across more than 400 million products. As Jenny Freshwater, Vice President of Traffic & Marketing Technology (and former VP of Forecasting), explains: “No amount of human brain power can forecast at that scale on a daily basis.” Traditional systems like manual logs or legacy computing software simply cannot handle this level of complexity.

During the Covid-19 pandemic, sales of toilet paper increased by 213%. While no model could have predicted the pandemic itself, Amazon’s forecasting systems adapted quickly to the new demand signals, helping the company restock efficiently and maintain customer trust during a critical moment.

By embedding predictive analytics into its workflows, Amazon has moved beyond reactive decision-making. The company consistently anticipates consumer needs, adjusts its inventory and supply chain strategies in real time, and sustains a competitive advantage by adapting faster than its rivals.

How Predictive Analytics Drives Sales and Improves Customer Experience

The power of predictive analytics lies in its ability to bridge two critical goals: boosting revenue and enhancing customer satisfaction.

On the sales side, predictive models optimize pricing strategies, improve demand forecasts, and increase conversion rates through more relevant product recommendations. By unifying data and applying AI forecasting, businesses can see powerful results. For example, ADA helped a global grocer achieve 136% ROI, a 15% forecast accuracy uplift, and significant revenue growth.

On the customer experience side, predictive analytics enables brands to move beyond generic interactions. Customers receive timely, personalised recommendations that reflect real-time preferences, while fulfilment becomes faster and more reliable through optimised inventory allocation. Churn prediction adds another layer of value, allowing businesses to intervene before customers disengage, ultimately strengthening loyalty and retention.

In essence, predictive analytics creates a win-win: businesses maximize efficiency and profitability, while customers enjoy a shopping experience that feels intuitive, personalised, and reliable.

Future Trends of Predictive Analytics in Ecommerce

  • Real-time AI-driven decision-making at scale
    The next wave is predictive models embedded directly into operations.This allows continuous adjustments to pricing, campaigns, and inventory in real time.
  • Hyper-Personalisation
    Personalisation is going deeper. Predictive models will stitch together data across web, mobile apps, social platforms, and offline touchpoints to offer consistent, context-aware recommendations. The emphasis is shifting from
  • Growth in Southeast Asia & Emerging Markets
    Emerging markets like Southeast Asia will see accelerated adoption of predictive analytics due to growing eCommerce penetration and mobile-first consumers. As

Conclusion: Predictive Analytics as the Growth Catalyst

Today, predictive analytics is no longer a nice-to-have, it is the backbone of competitive eCommerce. By turning historical and real-time data into foresight, businesses can anticipate demand, personalize customer experiences, optimize pricing, and streamline supply chains. The result is a shift from reactive decision-making to proactive, AI-driven growth strategies. Retailers who embrace predictive analytics will not only protect their margins but also unlock sustainable, scalable growth in an increasingly crowded digital marketplace.

At ADA, we partner with retailers to operationalise predictive analytics from demand forecasting to hyper-personalisation and real-time pricing. Our end-to-end data and AI ecosystem ensures predictions become business outcomes, not just numbers on a dashboard.

Contact the ADA team today to transform your eCommerce strategy with predictive insights that scale.

Table Of Contents
What is Predictive Analytics in Ecommerce?
Why Ecommerce Retailers Can’t Afford to Ignore Predictive Analytics
How Predictive Analytics Works: Key Models and Data Sources
Putting Predictive Analytics into Practice
How Amazon Uses Predictive Analytics
How Predictive Analytics Drives Sales and Improves Customer Experience
Future Trends of Predictive Analytics in Ecommerce
Conclusion: Predictive Analytics as the Growth Catalyst

How AI Transforms Healthcare: Risk Prediction to Clean Claims

Data & AI
Blogs

How AI Transforms Healthcare: Risk Prediction to Clean Claims

What If AI Could Reshape Healthcare?

This is no longer science fiction, this is healthcare’s reality in Southeast Asia alone, healthcare spending is projected to soar from USD 420 billion in 2023 to USD 740 billion by 2030, while AI in healthcare SEA is expanding at over 30% annually. The opportunity is immense, but so is the challenge. This explosive growth means healthcare providers face a critical decision: scale AI responsibly, or risk wasted investments.

The real question is not whether AI can transform healthcare, but whether organisations have the strong healthcare data foundation required to unlock its potential. Without high-quality, well-governed data, even the most advanced AI solutions fall short, leaving efficiency gains and revenue opportunities unexploited.

The Visible Challenge: Why AI Falls Short in Healthcare

Every healthcare executive knows the pain: data scattered across hospitals, labs, insurers, and regulators creates a fragmented system where no single source tells the whole story.

For all the promise of AI, many healthcare organizations struggle to see consistent results. The issue is rarely the algorithms, it is the data behind them.

Today, patient information is trapped within fragmented ecosystems. Hospitals, diagnostic labs, insurers, and national health systems each hold parts of the puzzle, but rarely in a unified way.

On top of that, issues like incomplete records, inconsistencies, and duplicates make the data unreliable from the start

The outcome? Predictive models trained on weak data deliver unreliable insights, eroding clinical trust and stalling ROI. Instead of driving smarter decisions, whether in predicting patient risks or ensuring accurate claims, AI risks becoming another expensive, short-lived experiment. These are the very healthcare data challenges that must be solved before AI can deliver lasting impact.

What is predictive analytics in healthcare?

Predictive analytics in healthcare uses patient data and AI models to forecast outcomes,  from disease risk and hospital readmissions to treatment effectiveness and fraud detection.

Despite these challenges, leading healthcare organisations are showing how predictive analytics in healthcare is becoming the engine of modern care, creating measurable value across the system:

  1. Patient risk and deterioration prediction enables earlier intervention, reducing readmissions and optimising bed utilisation. For example, AI can analyse vital signs and lab results in real time to flag when a patient in recovery is at risk of sepsis or cardiac arrest. Clinicians can then act before the condition escalates, preventing an ICU transfer and keeping hospital beds available for others.
  2. Population health management identifies at-risk groups, allowing for preventive strategies that reduce treatment costs. For instance, predictive models can flag communities with rising diabetes or hypertension rates. Health systems can then launch targeted screening or lifestyle intervention programmes, catching conditions early and lowering the long-term burden on the system.
  3. Resource optimisation helps hospitals forecast demand, improving staffing and inventory efficiency. AI can use seasonal patterns and local event data to predict patient surges, such as seasonal events like haze-related respiratory surges common in Southeast Asia. Hospitals can then adjust their staffing schedules, stockpile ventilators and oxygen, and avoid the bottlenecks that often overwhelm emergency departments.
  4. Insurance risk assessment and clean claims improve risk scoring, tailor coverage plans, and strengthen fraud detection, reducing disputes and payment delays. For example, AI can cross-check claims data with patient records to ensure that procedures billed actually occurred, flagging suspicious patterns like duplicate submissions. This not only reduces fraud but also speeds up claims approval for genuine patients, improving trust between insurers, providers, and members.

Predictive analytics in healthcare is no longer a “nice-to-have”, it is now essential in healthcare. From preventing patient deterioration to processing clean claims, the value is clear. But these results are only possible with the right healthcare data foundation. The data must be unified across systems, governed for quality and compliance, and trusted by both clinicians and administrators. Without this, even the best predictive models cannot deliver reliable outcomes.

The Limitation of Predictive Analysis No One Talks About

Here lies the uncomfortable truth. Across Southeast Asia, healthcare organisations are pouring millions into AI tools without addressing the data problem first.

Take the example of predictive readmission models. If the patient records being fed into the model are incomplete or inconsistent, for instance, if a patient’s medication history is recorded in one system but missing from another, the algorithm will deliver flawed predictions. The result is that doctors lose trust in the tool, patients miss out on timely interventions, and hospitals fail to see the promised efficiency gains.

The same applies to insurance claims. Without proper governance, duplicate or misclassified records can create errors in risk scoring or flag false positives for fraud. Claims get delayed, disputes increase, and instead of saving money, insurers end up adding costs and frustrating customers.

The reason is simple: data governance is often an afterthought. Information stays scattered across different systems, creating errors and inconsistencies that weaken trust in AI results. And when the predictions don’t work, AI takes the blame. But the real problem isn’t the algorithm, it’s the poor-quality, unmanaged data it depends on.

Until this limitation is addressed, investments in AI will continue to under-deliver, and the technology itself risks being seen as overhyped and less impactful than it truly is.

The New Standard: A Data-First Strategy

To unlock predictive analytics at scale, healthcare organisations need to flip the approach. Rather than starting with AI, they must adopt a data-first strategy, and this is where ADA differentiates itself. Healthcare leaders are realising that AI success depends less on the algorithm and more on the foundation beneath it. ADA sees this foundation as four pillars: interoperability, governance, scalability, and security

  • Unified data pipelines create a single source of truth across hospitals, labs, insurers, and regulators.
  • Governance-first design ensures quality, compliance, and security are embedded from the outset.
  • Scalable architecture future-proofs operations for advanced AI, precision medicine, and even cross-border health exchanges.
  • Interoperability at the core enables seamless data sharing across fragmented systems and devices.

This is ADA’s strength. We deliver not just AI capabilities, but the end-to-end, governed healthcare data foundation that makes predictive healthcare possible, sustainable, and trusted.

Building the Data Foundation: From Patient 360 to Hospital Command Center

Before AI delivers on its promise, the real work is in bringing all the data together. At ADA we’ve designed two key platforms, the Hospital Command Center and Patient 360 via Data Accelerator that underpin our predictive and governance capabilities.

1 The Building Blocks: What Powers ADA’s Healthcare AI

  • Clinical Data: Admissions, discharges, readmissions; ER wait times and triage scores; diagnosis and treatment records.
  • Operational Data: Bed occupancy & availability; staff scheduling and workload; equipment and medicine stock usage.
  • Administrative Data: Financial performance metrics; resource utilisation; hospital-wide KPIs.
  • External Data Integration: Standards-based ingestion via HL7, FHIR and REST APIs connecting labs, pharmacies and national health records.

2 How does it all come together?

  • Canonical data models (CDMs) to unify structured and unstructured input: IoT sensors (patient monitoring), EMR systems, logs and clinical notes.
  • Governed, curated datasets for reliable healthcare KPIs and analytics-ready assets.
  • Real-time pipelines and dashboards that deliver a unified source of truth for clinical, operational and administrative users.

3 Turning Data Into Impact

  • For the Hospital Command Center, real-time dashboards monitor bed occupancy, staff capacity and discharge planning. Predictive intelligence flags patient inflow/outflow trends and readmission risk. Automation and resource optimisation lead to measurable operational efficiency gains.
  • For Patient 360 / Data Accelerator, providers gain one unified view of each patient across systems. Prebuilt pipelines accelerate time-to-value. Data quality and governance improve markedly. Analytics scale across both clinical and operational decision-making.

With these data foundations firmly established, healthcare organisations are positioned to advance from predictive intelligence to the next phase of innovation. The integration of governed, interoperable, and analytics-ready datasets not only enables immediate operational and clinical gains but also creates the necessary infrastructure for emerging AI capabilities.

Generative AI: The Next Frontier

While predictive analytics in healthcare drives today’s gains, generative AI (GenAI) is rapidly emerging as the next frontier. A recent McKinsey survey found that 85% of healthcare leaders, from payers to health systems, are already exploring or implementing GenAI capabilities.

Key trends are shaping adoption:

  • Rapid implementation: Most organisations are moving beyond proofs of concept, progressing to real-world deployments. Early adopters are already seeing measurable impact, while laggards risk falling behind.
  • Partnerships over in-house builds: 61% of organisations are pursuing partnerships with vendors or hyperscalers, reflecting the complexity of building GenAI capabilities alone. Hyperscalers, in particular, bring critical expertise in data management and scale.
  • Focus on efficiency and engagement: Early GenAI use cases are streamlining administrative workflows, boosting clinical productivity, and improving patient engagement. These efficiencies create space for providers to focus on higher-value patient care.
  • Positive ROI: Among those who have implemented solutions, 64% report quantifiable positive returns, underscoring both the maturity and business case for GenAI in healthcare.

Still, the opportunities come with risks. Evolving regulations, compliance challenges, and internal capability gaps demand governed, interoperable, and value-driven strategies, the very areas where ADA’s data-first approach provides an advantage. With strong foundations, GenAI can move beyond back-office efficiencies into quality-of-care innovations that reshape patient experiences and define the future of healthcare AI.

The Future of Healthcare AI in Southeast Asia

The future of healthcare AI in Southeast Asia will not be defined by who adopts AI first, but by who builds the strongest data foundations. Those who invest today will lead in predictive care, precision medicine, and population health, delivering better outcomes for patients while improving efficiency and growth.

The stakes are clear: weak foundations lead to wasted AI spend, compliance gaps, and erosion of trust. Strong foundations, on the other hand, unlock scalable AI impact, governed and secure systems, and trusted adoption across clinicians and insurers.

The message is clear. The future of SEA healthcare depends on reliable, governed data foundations. And this is where ADA can help.

With our end-to-end solutions spanning data collection, organisation, analytics, and predictive as well as generative AI, we enable healthcare organisations to make informed decisions faster, reduce costs, and improve patient experiences. Contact ADA today to start building a data foundation your AI can truly trust.

Table Of Contents
What If AI Could Reshape Healthcare?
The Visible Challenge: Why AI Falls Short in Healthcare
What is predictive analytics in healthcare?
The Limitation of Predictive Analysis No One Talks About
The New Standard: A Data-First Strategy
Building the Data Foundation: From Patient 360 to Hospital Command Center
Generative AI: The Next Frontier
The Future of Healthcare AI in Southeast Asia

How to Use Customer Data Platforms (CDP) for Ecommerce Personalization

Data & AI
Blogs

How to Use Customer Data Platforms (CDP) for Ecommerce Personalization

Every ecommerce brand wants to make shopping feel personal,  yet few truly succeed. Despite investing in marketing, promotions and technology, customers are often met with generic offers, irrelevant emails and fragmented journeys. The result is lower engagement, reduced loyalty and lost revenue.

The truth is, most retailers don’t have a personalisation problem, they have a data problem. Personalisation fails when customer data lives in silos, updates slowly, or lacks the consistency needed to reflect real customer behaviour. Without a reliable data foundation, even the most advanced AI models or marketing automations can’t deliver the contextual relevance customers expect. This is where Customer Data Platforms (CDPs) come in. Rather than just another marketing tool, a CDP serves as the connective tissue powering intelligent commerce. It unifies customer information from every channel into a single, usable view, enabling brands to deliver targeted experiences that feel seamless, timely, and relevant. But personalisation is not just about sending the right email. It is about building trust, improving lifetime value and moving beyond one-size-fits-all campaigns.

But adopting a CDP isn’t just about technology; it’s about building the right data foundation to turn insight into action, and shifting from campaigns that speak to audiences, to conversations that speak to individuals.

Stages of Customer Data Maturity

Although all customer data solutions share the same ultimate goal of unifying and activating customer data, every retailer is at a different stage of data maturity. The real question is: where is your organisation on its journey from data collection to data-driven personalisation? Broadly, customer data solutions can be viewed across four maturity stages with Customer Data Platforms (CDPs) sitting at the core bridging insight and activation

1 Data Integration Systems – Building the Foundation

These focus on collecting data from multiple sources such as websites, apps, CRM and loyalty systems, and merging them into a single customer profile. They are ideal for businesses that struggle with fragmented data and need a strong foundation before moving into analytics or campaigns.

2 Analytics-Driven Services – Turning Data into Insight

Once data is unified, analytics-driven services provide insights: who your customers are, what they want and what they are likely to do next. They excel at segmentation and predictive analytics, making them a good fit for retailers ready to optimise their targeting and forecast trends.

3 Campaign Execution Services – Turning Insight into Action

These are designed to act on insights in real time by triggering personalised marketing campaigns across email, SMS, apps and websites. They are perfect for brands focused on outreach, engagement and retention. But when built on incomplete data, they can do more harm than good by amplifying inconsistencies instead of relevance.

4 Enterprise-Grade Solutions – Scaling with Trust and Governance

For large retailers with complex needs, enterprise-grade systems offer scalability, robust security, advanced compliance features and deep integration with other business systems. They are suited for organizations managing millions of records across multiple geographies.

Each of these categories sits under the same umbrella of customer data solutions but solves a different problem. Choosing the right one depends on whether your priority is building the data foundation, gaining insights, activating campaigns or scaling securely. When selecting among top customer data platforms, knowing which category you need is critical.

Core Features That Power Ecommerce Customer Data Solutions

Behind every truly personalised shopping experience is a powerful data foundation, not just the right tools, but the right capabilities working together. These features work together to create the backbone of personalisation.

1 Identity Resolution – Building the Single Source of Truth

This capability recognises and merges data from multiple touchpoints such as mobile, desktop, in-store and email to build a single view of each customer. This “single customer view” is the backbone of personalisation. Without it, personalisation efforts remain fragmented and inaccurate.

2 Segmentation – From Demographics to Intent

Traditional segmentation stops at demographics; modern CDPs go deeper, grouping customers dynamically based on behaviour, purchase patterns and engagement signals. This makes campaigns more precise, such as targeting high-value customers with exclusive offers or sending timely reminders to lapsed shoppers.

3 Real-Time Data Processing – Keeping Personalisation Relevant

In today’s e-commerce landscape, relevance has a shelf life of seconds. Customer behaviour changes constantly. Real-time processing ensures that profiles are updated immediately, so the recommendations or offers a shopper sees today reflect their latest actions, not outdated information.

4 AI-Driven Recommendations – Turning Data into Experience

Machine learning is where insights become action. It analyses vast amounts of data to predict what customers might want next. This could be suggesting complementary products, personalising homepage content or recommending loyalty rewards likely to motivate purchase.

Together, these features turn raw information into actionable insights and automated personalisation at scale, a capability often associated with leading CDP platforms.

Applications of Customer Data Solutions in Ecommerce Personalisation

Once a strong data foundation is in place, the power of a Customer Data Platform (CDP) for ecommerce becomes tangible. Personalisation powered by customer data services can be applied across many areas of the online shopping experience. Here are some of the most common examples.

1 Personalised Product Recommendations

An online fashion retailer uses browsing history and past purchases to recommend outfits that complement items already in a customer’s basket. This increases average order value through cross-selling.

2 Dynamic Website and App Content

A beauty brand shows personalised banners on its homepage, promoting skincare routines based on a visitor’s previous purchases and preferences, creating a more relevant shopping journey.

3 Email and SMS Personalisation and Targeting

A pet supply store sends follow-up emails timed to when customers typically reorder dog food, boosting repeat purchases and retention.

4 Abandoned Cart Recovery with Tailored Offers

A home décor shop sends a discount code on the exact lamp a customer left in their cart, prompting them to complete the purchase.

5 Loyalty and Retention Campaigns Based on Behaviour

A subscription box service identifies its most active subscribers and offers them early access to new products, while also re-engaging at-risk customers with special renewal offers.

6 Lookalike Audience Building for Acquisition

A sports equipment retailer analyses its top customers’ profiles and then syncs these high-value segments to ad platforms, where algorithms identify similar prospects for targeting. This enables more efficient acquisition and mirrors a capability often supported by leading CDPs.

Across industries, brands applying these practices report higher order values, lower cart abandonment and stronger long-term customer loyalty.

Challenges and Best Practices When Implementing Customer Data Personalisation

Many retailers underestimate the complexity of personalisation. Ignoring the real challenges can lead to costly mistakes. Some of the most common pain points include:

1 Fragmented and Inconsistent Data

Retailers often underestimate how legacy systems quietly sabotage personalisation. Customer information is often spread across multiple systems such as e-commerce websites, mobile apps, CRM, email marketing and loyalty schemes. Without proper integration, data becomes duplicated, outdated or incomplete. This results in inaccurate profiles and ineffective targeting.

Principle: Data unification before activation.

Every successful CDP implementation is built on the journey toward a single, trusted view of the customer. The one that consolidates, cleanses and governs data before it reaches any marketing layer.

2 Compliance and Privacy Risks

With regulations like GDPR and other data protection laws, collecting and using customer data incorrectly can lead to legal penalties and reputational damage. Many retailers lack clear processes for consent management and secure data handling.

Principle: Compliance is not a checklist, it’s a trust strategy.

Retailers that integrate privacy by design, audit data flows regularly, and make consent management visible don’t just avoid risk; they build loyalty through integrity.

3 Siloed Teams and Poor Adoption

Marketing, IT and customer experience departments often work separately. This makes it difficult to share insights and coordinate campaigns. We often see brands rush to adopt advanced CDPs without first aligning on shared goals or KPIs, resulting in inconsistent execution and underused capabilities.

4 Slow or Outdated Data Processing

If customer data updates only once a day or once a week, recommendations and campaigns become irrelevant by the time they reach the customer. Real-time interactions require systems capable of instant updates.

Principle: Real-time intelligence drives real-time engagement.

Modern CDPs for ecommerce process updates instantly, allowing brands to react to intent as it happens, not after it fades.

5 Overly Complex Implementations

Jumping straight into enterprise-scale personalisation without a phased plan can overwhelm teams, delay results and waste budget.

Principle: Maturity is built in phases, not leaps.

Start with the use cases that bring visible impact such as abandoned cart recovery, replenishment reminders, or loyalty reactivation. Then scale into predictive and AI-driven personalisation as your data foundation strengthens.

With these practices in place, customer data personalisation moves from a difficult, risky undertaking to a powerful driver of growth and customer satisfaction.

Conclusion

Ecommerce personalisation isn’t just about knowing what to recommend next, it’s about knowing your customer well enough to act on that insight instantly and responsibly. That level of intelligence doesn’t come from more marketing tools, but from a stronger data foundation.

With a modern customer data solution for ecommerce, brands can turn fragmented data into a powerful engine for engagement, loyalty and growth.

Ecommerce personalisation succeeds when it’s built on a strong data foundation, not just more technology. The real advantage comes from data maturity: connecting strategy, infrastructure, and execution through a single, trusted view of the customer.

Forward-thinking retailers are already moving this way, using customer data strategies powered by AI to turn insight into real-time engagement.

At ADA, we help businesses build that foundation, from unifying data, ensuring governance, and activating intelligence across every channel. The result is scalable, AI-driven personalisation that turns every interaction into a moment of value.

Table Of Contents
Stages of Customer Data Maturity
Core Features That Power Ecommerce Customer Data Solutions
Applications of Customer Data Solutions in Ecommerce Personalisation
Challenges and Best Practices When Implementing Customer Data Personalisation
Conclusion

How Customer Data Platforms (CDPs) Power Growth in the Retail Sector

Data & AI
Blogs

How Customer Data Platforms (CDPs) Power Growth in the Retail Sector

Have you ever wondered why, despite collecting vast amounts of customer data, your marketing campaigns still miss the mark?

You’re not alone. 44% of marketers say they struggle with fragmented data scattered across multiple databases, making it nearly impossible to deliver the kind of personalised experiences customers now expect. Many retailers struggle with fragmented information spread across various channels that prevents them from seeing a clear, unified picture of their customers. Without that single view, opportunities for stronger loyalty, smarter promotions, and more informed decision-making are often lost.

This is where a Customer Data Platform (CDP) comes in. A customer data platform for retail businesses solution centralises, unifies, and manages customer data from multiple sources to create comprehensive customer profiles. In the retail sector, it provides businesses with a complete view of their customers, enabling more targeted marketing, improved retention, and sustainable growth. By working with unified data, retailers can strengthen engagement and loyalty programmes while ensuring every interaction feels more relevant.

How CDPs Benefit the Retail Sector

Retailers today generate huge amounts of data from websites, mobile apps, loyalty schemes, email campaigns and in-store systems. Without a way to bring this data together, valuable insights remain hidden and customer experiences stay fragmented.

A retail CDP solves this challenge by serving as a central hub that gathers customer data from every online and offline touchpoint. This includes online purchases, point-of-sale transactions, customer support interactions, social engagement and third-party sources. It then organises, cleans and unifies this information into individual customer profiles, and forms a unified customer view that serves as a reliable source of truth for marketing and engagement

With the rise of AI-driven personalisation and tighter privacy regulations, building this unified data foundation is no longer optional, it’s now the cornerstone of competitiveness. Retailers that embrace a unified retail data strategy through a modern, omnichannel-capable CDP can unlock richer insights, deliver consistent engagement across channels, and ensure compliance without sacrificing personalisation.

This process matters because it creates a single, accurate source of truth about each customer. Retailers can see patterns that would otherwise go unnoticed, such as repeat purchasing behaviour or signs that a customer may be about to leave. With this clarity, marketing and operations teams can plan actions based on real evidence rather than guesswork.

The benefits extend beyond marketing teams. Product managers gain a clearer view of demand trends, helping them choose which products to stock or promote. Customer service teams can personalise support by accessing a customer’s complete history. Senior decision-makers can forecast more accurately and allocate budgets more effectively.

In short, a Customer Data Platform for retail businesses doesn’t just store data, it transforms scattered information into actionable intelligence. This unified approach allows retailers to deliver more relevant offers, strengthen loyalty programmes, reduce churn and make smarter operational decisions across the business.

Overcoming CDP Implementation Challenges in Retail

Even with the right strategy, implementing a CDP e-commerce solution can be challenging when deeper organisational silos exist. Data is often scattered across regions, systems, and teams, the result of years of growth without clear integration or governance. This leads to inconsistent data quality, duplicated records, and fragmented customer journeys that limit the effectiveness of the CDP solution.

Technology alone cannot fix data silos. The real issue often lies in alignment between marketing, IT, and operations. A successful retail CDP strategy depends on collaboration and shared ownership of data governance, ensuring every department contributes to and benefits from a unified customer view.

When these problems are identified early, retailers can take proactive steps to address them before they affect performance. This may include setting clear data standards, developing a cross-department integration plan, and selecting a CDP service that can connect seamlessly to existing systems. Early action makes it far easier to ensure a smooth rollout and minimise disruption.

If the issues are discovered later, such as when campaigns begin to underperform or customers start receiving inconsistent messages, recovery is still possible. It typically involves a structured clean-up phase where data is audited, duplicate records are removed, and a phased integration approach is implemented. The key to long-term success is a strong data governance framework that aligns IT, marketing, and operations teams around a shared goal of delivering consistent, personalised experiences.

Regardless of timing, there are three essential steps to overcoming these challenges:

  • Choose a scalable CDP that supports multiple data sources.
  • Strengthen collaboration to improve accuracy and trust.
  • Enforce privacy and compliance to maintain customer confidence.

Together, these steps represent retail CDP integration best practices that turn data challenges into strategic advantages.

Key CDP Use Cases in Retail

1 Personalised Marketing Campaigns

How it works: A CDP gathers purchase history, browsing behaviour and customer preferences from every channel and builds a unified profile for each shopper. This data allows marketing teams to craft messages, offers and promotions that directly match what individual customers are most likely to respond to.

Example: A fashion retailer can identify customers who frequently browse but rarely buy, then send them targeted discounts on the items they view most often. With AI-powered insights from CDPs”, these campaigns can also be automated and optimised in real time, improving conversion rates and reducing ad waste.

2 Omnichannel Customer Engagement

How it works: By combining data from physical stores, e-commerce sites, mobile apps and email, a CDP creates a consistent customer identity across all channels. This makes it possible to deliver the same message and level of service regardless of where the customer interacts.

Example: A homeware brand uses its CDP to recognise a customer who browses products online and then visits the store. Staff can instantly access the customer’s browsing history and recommend matching items in person, creating a seamless shopping experience.

3 Loyalty and Rewards Optimisation

How it works: A CDP analyses loyalty programme data alongside purchase behaviour and engagement patterns. This enables retailers to adjust reward tiers, timing and incentives based on what motivates each customer segment.

Example: A supermarket chain notices that a group of customers regularly buy premium products but rarely redeem loyalty points. By offering tailored double-point promotions on those items, it encourages repeat spending and deeper loyalty.

4 Product Recommendations and Upselling

How it works: Using real-time behavioural data, CDPs generate product suggestions linked to each customer’s purchase history and interests. These insights can be applied online, in email campaigns or even in-store via staff devices.

Example: An electronics retailer can automatically recommend compatible accessories after a customer buys a new phone. AI-enabled product recommendation engines with CDPs can refine suggestions with every interaction, maximising relevance and upsell opportunities.

5 Customer Segmentation for Targeted Offers

How it works: A CDP allows for dynamic segmentation by blending demographic, transactional and behavioural data. Retailers can quickly identify high-value groups, new customers or at-risk segments and address each with a specific marketing message.

Example: A beauty brand uses its CDP to create a segment of customers who purchased skincare products within the last three months. It then sends those customers a personalised trial offer for a new complementary product, resulting in higher take-up rates.

6 Reducing Churn with Predictive Analytics

How it works: Some CDPs include predictive models that flag customers likely to reduce their spending or leave entirely. Retailers can then take proactive measures to re-engage them.

Example: A subscription box company sees that a segment of customers has reduced their order frequency. With an AI-powered CDP, it automatically triggers a personalised offer to re-engage the group, improving retention and protecting revenue.

7 Inventory and Demand Planning Insights

How it works: By analysing aggregated purchase patterns and customer interest trends, a CDP can reveal which products are gaining or losing popularity. This helps retailers plan stock levels and forecast demand with greater accuracy.

Example: A sports retailer notices through its CDP that a new line of trainers is trending among a certain age group before sales peak. It increases orders in time to meet the surge in demand, reducing stockouts and lost sales.

8 Real-World Example: How Zalora Uses Data to Power Retail Success

A strong example from Southeast Asia is Zalora’s Southeast Asia Trender Report 2022. As one of the region’s leading online fashion retailers with over 59 million monthly visits, Zalora taps into extensive customer transaction and behavioural data collected through its platform. It uses these insights to help brands understand shifting preferences, purchase behaviour and emerging retail trends across diverse, mobile-first markets.

This data-driven approach powers hyper-personalisation, targeted marketing and accurate trend forecasting, illustrating how a unified view of customer data can drive better experiences and stronger results. The report is publicly available and offers a clear example of how Asian retailers are already using integrated data to transform marketing and customer engagement, even if they do not specifically refer to it as a CDP. For retailers seeking a customer data platform case study, it serves as a strong demonstration of what effective data integration can achieve.

As more Southeast Asian retailers adopt CDP frameworks, the competitive advantage will shift from access to insight, from who has data to who uses it best.

Mapping Out a CDP Strategy for Retail

Retailers that successfully embed a CDP into their operations often see transformational results. By moving from scattered, inconsistent information to a unified customer view, they are able to deliver experiences that feel personal at scale, strengthen loyalty programmes, and make smarter inventory and marketing decisions. In highly competitive markets, this capability can be the difference between incremental growth and a real step change in performance.

To achieve this, retailers need more than just the technology. They need a clear, deliberate strategy. A CDP is most effective when it is aligned with the business’s wider objectives and supported by consistent processes across departments. When implemented correctly, it becomes not only a source of customer insights but also a driver of operational efficiency and long-term value.

The most successful approaches typically follow four key steps:

  • Define clear goals linked to business priorities. Start by identifying what you want the CDP to achieve, such as increasing customer lifetime value, improving campaign effectiveness or gaining better demand forecasts. Goals provide a benchmark for measuring success.
  • Integrate customer data from all relevant sources. Bring together data from online and offline interactions, loyalty schemes, support channels and third-party sources. Make sure the data is accurate, complete and compliant with privacy regulations to ensure the insights are reliable.
  • Use insights to execute personalised campaigns and consistent engagement across channels. With a unified customer view, marketing teams can deliver offers and content that resonate, while customer service teams can provide informed support across every touchpoint.
  • Continuously measure results and refine tactics using real-time analytics. Monitoring outcomes allows you to adapt campaigns, optimise incentives and adjust operations to maintain impact over time.

Conclusion

Retailers that follow these steps can expect tangible benefits: higher conversion rates, stronger repeat purchase behaviour, more effective loyalty programmes and better demand planning. Over time, a CDP strategy can shift customer relationships from transactional to truly personalised, creating a competitive advantage that is difficult for others to replicate.

True transformation does not come from adding another system. It happens when data, people, and purpose work in alignment. Retailers that establish clear objectives, enforce strong data governance, and activate insights in real time will define the next era of customer experience.

The future of retail growth will belong to those who use better data and make it unified, governed, and AI-ready.

At ADA, our AI-Powered Customer Data Platform solutions help retailers integrate, govern and optimise their data so they can deliver measurable results from day one.

By taking this step now, retailers can move from fragmented data and missed opportunities to a future of stronger loyalty, higher growth and truly personalised customer experiences.

Get in touch with ADA today.

Table Of Contents
How CDPs Benefit the Retail Sector
Overcoming CDP Implementation Challenges in Retail
Key CDP Use Cases in Retail
Mapping Out a CDP Strategy for Retail
Conclusion

Data-First AI in Healthcare: Unlocking Personalised Care

Data & AI
Blogs

Data-First AI in Healthcare: Unlocking Personalised Care

Healthcare stands at a turning point. The sector is under immense pressure to harness artificial intelligence (AI) not as a distant possibility, but as an urgent necessity. The familiar phrase rings true: AI will not replace doctors, but those who work effectively with AI will outpace those who do not. This reflects a profound shift where clinical expertise, supported by intelligent systems, becomes the benchmark of modern medicine. The rise of AI in healthcare in Southeast Asia exemplifies this transformation, but its success depends not on algorithms alone, but on a strong foundation of healthcare data governance and predictive analytics in healthcare.

The promise is immense. Globally, the healthcare AI market is projected to reach USD 200 billion by 2030 (Statista), with Southeast Asia among the fastest-growing regions for adoption. Yet, the real challenge is often overlooked: AI is only as effective as the data it relies on. Without a well-governed healthcare data foundation of accurate and reliable data, even the most advanced systems cannot deliver the improvements that healthcare so urgently requires.

Solving Data Silos in Healthcare Systems

The warning signs often appear before the root cause is understood. Healthcare providers may notice delays in diagnosis, inconsistencies in patient records, or inefficiencies in operations, yet struggle to identify why these issues persist. What sits beneath many of these challenges is not a lack of clinical expertise or medical technology, but the way data is managed, highlighting gaps in data maturity in healthcare.

In most healthcare organisations, data lives in silos:

  • Electronic Medical Records (EMRs)
  • Insurance claims
  • Connected medical devices
  • Imaging systems

Electronic Medical Records, insurance claims, connected medical devices, and imaging systems each hold valuable information, but they rarely communicate with one another. This fragmentation prevents clinicians from seeing the complete picture of a patient’s health, making decision-making slower and sometimes less accurate.

The impact is felt on multiple levels. Patients, who increasingly expect care tailored to their individual needs, can be left frustrated when their care providers only see partial information. For organisations, the risks are equally significant. Disconnected data increases the likelihood of fraud going undetected, regulatory requirements being missed, and resources being wasted on redundant or inefficient processes.

To meet modern expectations and deliver safe, effective, and personalised care, healthcare must address this challenge directly. The priority is not simply to collect more data, but to unify and govern it in a way that makes it accessible, reliable, and actionable across the entire system of care.

Predictive Analytics in Healthcare: From Data to Foresight

For many healthcare providers, the first wave of digital transformation has already taken place. Records have been digitised, and basic systems provide snapshots of recent information through visual summaries and reports. This represents progress, but it is also a limitation. Static dashboards are like looking in the rear-view mirror: they tell you what has already happened but cannot predict what lies ahead.

The next step is predictive analytics in healthcare.  This approach moves beyond describing the past to forecasting what is likely to happen in the future. By applying statistical models and machine learning techniques to unified data, predictive systems can highlight patterns that are invisible to the human eye and alert clinicians or administrators before an issue escalates.

The potential applications of predictive models in healthcare are far-reaching.

Identifying patients at risk of developing post-surgical complications, so care teams can intervene earlier and prevent costly readmissions

This shift from reactive care to proactive prevention is not optional; it is the natural evolution of healthcare in a data-driven world. Predictive analytics equips providers with foresight, helping them not only to improve patient outcomes but also to manage costs, reduce inefficiencies, and build trust with patients who expect care that is anticipatory rather than delayed.

Despite the clear benefits, adoption remains uneven. Many organisations still struggle with the technical and operational barriers of implementing predictive systems, such as integrating data across departments, ensuring its quality, and aligning staff to new ways of working. These challenges reflect a deeper issue: healthcare AI often suffers from “fragile AI”,  predictive systems trained on fragmented or low-quality data that cannot be trusted in critical settings.

This points to a deeper issue: if predictive analytics depends on trust, then healthcare must first solve the Data Trust Problem.

The Data Trust Problem in Healthcare AI

If predictive analytics depends on trust, what exactly is missing? The answer is the data trust problem. Healthcare data today is fragmented, inconsistent, and often unreliable, making it unfit for powering life-critical AI. Hospitals, labs, insurers, and regulators each hold pieces of the puzzle, but rarely in a unified, interoperable form. The result is that AI systems, no matter how advanced, inherit the weaknesses of the data they are trained on.

Build, Scale, and Automate

The promise of predictive analytics in healthcare cannot be realised without a stronger foundation. Many organisations have already seen the limitations of AI models that deliver inconsistent results or fail to reflect the realities of clinical practice. The issue is rarely the technology itself, but the quality and governance of the data it depends on.

Trust, therefore, is central to progress. Clinicians, patients, and regulators are right to demand clarity and reliability from AI-driven insights. This is why ADA frames healthcare’s AI journey through its Data Maturity Curve: Build, Scale, Automate.

This is where a new standard is taking shape, built on three essential stages: Build, Scale, and Automate.

  • Build: Consolidate and govern data across the ecosystem into a secure, trusted source of truth. This is the foundation stage, where ADA helps providers move from fragmented records to unified, reliable data.
  • Scale: With solid foundations, predictive analytics can be applied with confidence. At this stage, providers begin to uncover trends, forecast risks, and improve care quality. On the data maturity curve, this is the point where organisations evolve beyond basic reporting and optimisation into advanced, predictive systems — and ADA has guided many providers through this progression.
  • Automate: Once predictive systems are reliable, automation allows healthcare to achieve efficiency at scale. From fraud detection to personalised care plans, automation not only streamlines operations but also gives clinicians more time to focus on what matters most: patient care. ADA has been at the forefront of helping providers implement these intelligent automation services (the higher end of the data maturity curve) in ways that build long-term resilience.

Each stage builds on the one before it, forming a pathway that transforms data from a fragmented liability into an enabler of progress. This structured journey reflects the data maturity curve that many organisations now find themselves navigating. ADA’s leadership in guiding providers along this path shows how healthcare can advance towards a future where trustworthy data fuels predictive, proactive, and patient-centred care.

Conclusion

The path to better healthcare is no longer optional; it is essential. The next decade will not be about whether hospitals adopt AI, but about which health systems can turn their data into a trusted asset fast enough to keep pace with rising patient demand, stricter regulations, and cost pressures.

Organisations that move deliberately through the stages of Build, Scale, and Automate will not just improve efficiency, they will set the standard for predictive, patient-centred care in Southeast Asia’s rapidly evolving healthcare landscape.

The real future of AI in healthcare is not defined by breakthrough algorithms, but by the resilience of the data foundation beneath them. Those who invest early in trustworthy, governed data will unlock AI that is reliable, explainable, and future-proof, while those who hesitate risk building fragile systems that collapse under real-world pressure.

ADA is already helping healthcare providers turn disconnected data into a reliable foundation for smarter, more sustainable AI. To take the first step towards this new standard, get in touch with ADA today.

Table Of Contents
Solving Data Silos in Healthcare Systems
Predictive Analytics in Healthcare: From Data to Foresight
The Data Trust Problem in Healthcare AI
Build, Scale, and Automate
Conclusion

10 Proven Ecommerce Promotion Strategies to Boost Sales and Revenue

Identity
Blogs

10 Proven Ecommerce Promotion Strategies to Boost Sales and Revenue

Free Shipping (Threshold-Based or Sitewide)

How and Why It Works:
Free shipping removes one of the biggest barriers to purchase, helping to reduce basket abandonment. Threshold-based free shipping encourages customers to add more items to reach the minimum spend, increasing average order value (AOV). Sitewide free shipping, on the other hand, simplifies the decision-making process by eliminating unexpected fees altogether.

Example:
Amazon offers free shipping on orders over $25, encouraging customers to add extra items to qualify.

What to Avoid:

  • Setting thresholds that are far above the average order value
  • Ignoring the impact on margins when shipping costs are absorbed
  • Adding shipping fees late in the process, which creates frustration

Tips for Success:

  • Position free shipping thresholds just above your average order value to drive upsells
  • Communicate shipping policies clearly and early
  • Use sitewide free shipping during key holidays to maximise conversions

Limited-Time Flash Sales or Deal of the Day

How and Why It Works:
Flash sales create urgency and scarcity, prompting quick decisions from shoppers who fear missing out. These ideas for promotions generate short bursts of traffic and are effective at converting hesitant buyers.

Example:
Sephora’s “Deal of the Day” encourages daily check-ins as customers look for limited-time offers.

What to Avoid:

  • Overusing flash sales, which trains customers to wait for discounts
  • Poorly communicating the sale duration, leading to confusion
  • Frequent sales that weaken brand perception

Tips for Success:

  • Build anticipation by promoting sales in advance through email and social channels
  • Use countdown timers to make urgency visible and credible
  • Focus discounts on specific, high-impact products rather than across the board

First-Order “Welcome” Discount

How and Why It Works:
A first-order discount lowers the barrier to entry for new customers, encouraging trial while also building your email list. This marketing promotion idea can be highly effective for acquisition.

Example:
New customers get 15% off their first purchase after subscribing to its newsletter.

What to Avoid:

  • Offering discounts so large that they undermine profitability
  • Allowing discounts to be used repeatedly
  • Forcing signups without a clear and immediate benefit

Tips for Success:

  • Deliver welcome offers instantly after signup to capture interest
  • Set expiry dates to create urgency
  • Keep redemption simple with automatic discounts or easy codes

BOGO, Multi-Buy and Quantity Breaks

How and Why It Works:
Buy One, Get One (BOGO) deals and tiered discounts encourage larger purchases. They also help clear inventory while being one of the best eCommerce offers for high-margin items.

Example:
CVS Pharmacy often runs BOGO promotions on health and beauty items, increasing sales volume.

What to Avoid:

  • Applying BOGO to low-margin products
  • Making rules overly complex
  • Offering deals on clearance stock not intended for fast turnover

Tips for Success:

  • Clearly display the savings customers will enjoy
  • Focus promotions on strong-margin products
  • Use tiered discounts to motivate higher spending

Product Bundles to Lift AOV

How and Why It Works:
Bundling complementary items enhances perceived value and convenience while increasing average order value. Customers see ready-made solutions, not just individual products.

Example:
Dollar Shave Club offers bundles of razors, blades and shaving cream at a discounted price, encouraging larger purchases.

What to Avoid:

  • Bundling unrelated or slow-moving products
  • Applying discounts so steep that they erode margins
  • Failing to promote bundles prominently

Tips for Success:

  • Group naturally related products together
  • Balance discounts to remain profitable
  • Feature bundles on key site pages to maximise visibility

Gift with Purchase (GWP)

How and Why It Works:
A free gift adds perceived value without heavy discounts. This marketing promotion idea motivates customers to increase spend while leaving a positive impression.

Example:
Clinique offers travel-sized products free with orders over $50, boosting average basket size.

What to Avoid:

  • Giving irrelevant or low-value gifts
  • Providing costly items without setting a minimum spend
  • Failing to explain the qualification clearly

Tips for Success:

  • Choose gifts that are desirable and relevant to your audience
  • Set spend thresholds to increase order size
  • Promote the offer widely and clearly across your site

Loyalty Rewards and Referral Incentives

How and Why It Works:
Rewards programmes encourage repeat purchases through points or perks, while referral incentives leverage existing customers to bring in new ones. Both approaches strengthen customer lifetime value.

Example:
Starbucks Rewards offers points for purchases and bonuses for referrals, boosting both frequency and acquisition.

What to Avoid:

  • Making the reward structure too complicated
  • Allowing rewards to expire without reminders
  • Overlooking referral fraud risks

Tips for Success:

  • Keep rewards simple and achievable
  • Offer exclusive perks or early access to make programmes attractive
  • Provide easy-to-use referral tools with clear benefits

Abandoned-Basket and Exit-Intent Offers

How and Why It Works:
Targeting customers who leave without completing their purchase helps recover lost sales. Timely offers or reminders address hesitation and nudge them to return.

Example:
Wayfair uses exit-intent pop-ups with discounts, as well as abandoned-basket emails, to re-engage potential buyers.

What to Avoid:

  • Sending too many messages or intrusive pop-ups
  • Offering discounts so steep that they cut too deeply into profit
  • Sending generic, impersonal reminders

Tips for Success:

  • Send personalised recovery emails within an hour
  • Use exit-intent offers such as free shipping or small discounts
  • Include product images and details to jog memory

Seasonal and Holiday Campaigns

How and Why It Works:
Tying promotions to seasonal moments or holidays creates relevance and urgency. Customers are more motivated to buy when offers align with current needs or occasions.

Example:
Macy’s runs back-to-school promotions with targeted discounts, driving seasonal demand.

What to Avoid:

  • Launching too late and missing peak shopping windows
  • Using generic campaigns that lack emotional connection
  • Discounting too heavily, damaging margins

Tips for Success:

  • Plan campaigns early and align creative to the season
  • Use themed visuals and copy that connect emotionally
  • Combine offers such as free shipping with a percentage discount

Influencer, Affiliate Promo Codes and Social Giveaways

How and Why It Works:
identifies the best eCommerce offers for your business context, helps you optimise pricing, personalise offers and allocate resources to maximise ROI. With continuous tracking and actionable recommendations, ADA ensures every marketing promotion idea is data-driven and performance-focused.

With ADA’s technology and strategic guidance, businesses can move beyond guesswork to run smarter, data-driven promotions that increase revenue while protecting margins. This ensures promotional efforts not only deliver short-term sales uplifts but also build long-term customer loyalty and sustainable growth.

Ready to unlock the full revenue potential of your eCommerce promotions?

Partner with ADA to harness tailored strategies, expert support and impactful ideas for promotions that deliver measurable results. Influencers and affiliates help brands reach targeted audiences with authentic endorsements. Promo codes enable tracking, while giveaways build excitement and expand reach.

Example:
A fitness apparel company partners with micro-influencers who share unique promo codes, increasing sales and followers.

What to Avoid:

  • Working with influencers who lack audience alignment
  • Running campaigns without clear KPIs
  • Overusing giveaways, which can dilute brand value

Tips for Success:

  • Vet influencers carefully to ensure relevance
  • Create exclusive, trackable codes
  • Encourage sharing through engaging social giveaways

How to Choose the Right Promotion and Measure Its Effectiveness

The most effective promotions are not chosen at random but carefully designed to balance profitability, inventory priorities and customer behaviour. Measuring impact is just as important as execution, ensuring that promotions genuinely grow revenue instead of simply shifting sales or cutting into margins.

Selecting the Right Promotion

Consider Your Margin
Choose promotions that protect profitability. High-margin products can support deeper discounts or BOGO deals, while low-margin or commodity items are better suited to offers such as free shipping or gift-with-purchase. Always evaluate the expected margin impact before launching.

Evaluate Inventory Levels
Promotions are a powerful tool for managing stock. Use flash sales or multi-buy offers to clear excess inventory, but avoid heavy discounts on popular items that sell well at full price. Bundling slow-moving products with bestsellers can increase appeal without hurting profits.

Understand Your Audience
Tailor promotions to different customer segments. First-time buyers may respond strongly to welcome discounts, while returning customers are often motivated by loyalty rewards, bundles or exclusive perks. Analysing purchasing patterns helps ensure offers meet expectations and resonate.

Measuring Lift and Avoiding Cannibalisation

Track Incremental Sales Lift
Compare promotional sales against historical baselines. True lift means attracting new customers or higher spend per order, not simply shifting the timing of purchases.

Monitor AOV and Customer Acquisition Cost (CAC)
Ensure promotions drive meaningful improvements. For example, a free shipping threshold that raises order size by 20 per cent with minimal margin impact is a positive outcome.

Segment Customers for Cannibalisation Analysis
Determine whether promotions are attracting new customers or simply encouraging existing ones to make purchases earlier at a discount. Use A/B testing or control groups for reliable insights.

Avoid Common Pitfalls
Too many discounts, or those applied too broadly, can train customers to delay purchases. Instead, use exclusivity such as first-time buyer offers or bundles to create value without undermining full-price sales.

Conclusion

Promotions are some of the most powerful levers for accelerating eCommerce growth when used strategically. From free shipping and flash sales to loyalty rewards and influencer campaigns, each tactic provides distinct ways to attract, engage and retain customers. The key lies in selecting the right promotion ideas for your margin and inventory position, executing them with precision, and measuring impact carefully to ensure incremental revenue without cannibalisation.

This is where ADA’s expertise becomes invaluable. By combining advanced analytics and artificial intelligence, ADA uncovers customer insights and behavioural predictions.

Table Of Contents
Free Shipping (Threshold-Based or Sitewide)
Limited-Time Flash Sales or Deal of the Day
First-Order “Welcome” Discount
BOGO, Multi-Buy and Quantity Breaks
Product Bundles to Lift AOV
Gift with Purchase (GWP)
Loyalty Rewards and Referral Incentives
Seasonal and Holiday Campaigns
Influencer, Affiliate Promo Codes and Social Giveaways
How to Choose the Right Promotion and Measure Its Effectiveness
Conclusion