We helped a leading retail brand grow revenue and increase customer retention by implementing a ML-driven Customer Lifetime Value model

The client faced a challenge with the lack of predictive insights into customer spending, leading to uncertainties in strategic decisions, and inefficient customer segmentation, causing suboptimal retention strategies and marketing inefficiencies.
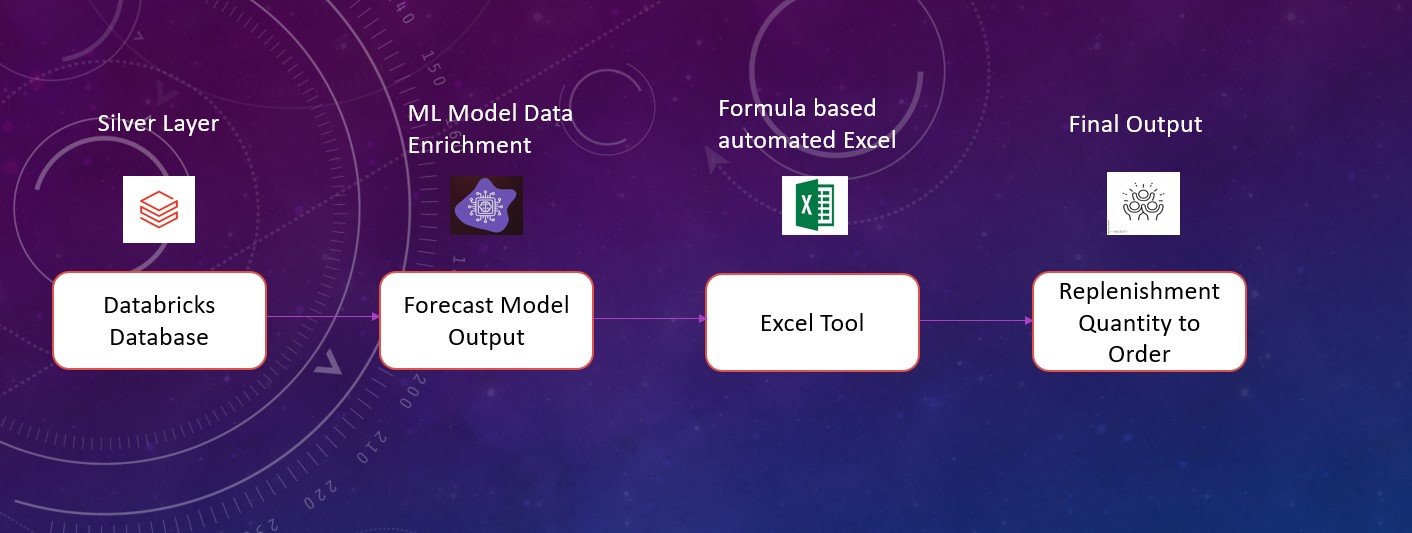
ADA helped to implement a machine learning-driven Customer Lifetime Value (CLV) model, intricately forecasting customer spend and churn, which, alongside Salesforce integration, enhanced targeted marketing efforts and enabled data-driven decision-making to significantly improve customer retention and sales outcomes.
The new model resulted in an 8% reduction in churn rates, a 20% increase in revenue from CLV-based marketing campaigns, and a 17% boost in customer retention through personalized incentives.