

We helped leading ecommerce brand reduce customer churn and reengage their buyers with data analytics and data strategy
Retail

The Results
Successful Re-engagement Strategy | 5 Key Customer Segments Defined | Efficient Re-engagement Parameters Established
- 9% reduction in customer churn rate.
- Optimal discount sweet spots identified for each customer segment.
- Efficient re-engagement timeline established at 18 days.
The Challenge
A leading kidswear e-commerce brand in India, serving more than 2 million customers, was facing a growing customer retention challenge. Nearly 46% of first-time buyers did not return to make a second purchase, resulting in an estimated USD 2.5 million in lost revenue over six months.
The brand lacked a structured approach to understanding why one-time buyers churned and how to re-engage them effectively. Broad, untargeted promotions led to excessive discounting with limited impact, while inconsistent audience targeting meant many high-potential customers were overlooked.
The client needed a data-driven strategy to identify the most valuable customer segments, determine the optimal timing for engagement, and deliver the right level of incentives to increase repeat purchases while protecting profit margins and optimising marketing spend.
The Solution
The client is the service division of a leading global consumer electronics brand. While committed to improving its digital customer experience, the organisation lacked clear evidence of how website usability influenced service conversion rates.
Previous user experience (UX) improvements were based primarily on qualitative observations rather than quantitative data, making it difficult to measure their impact or prioritise design changes effectively.
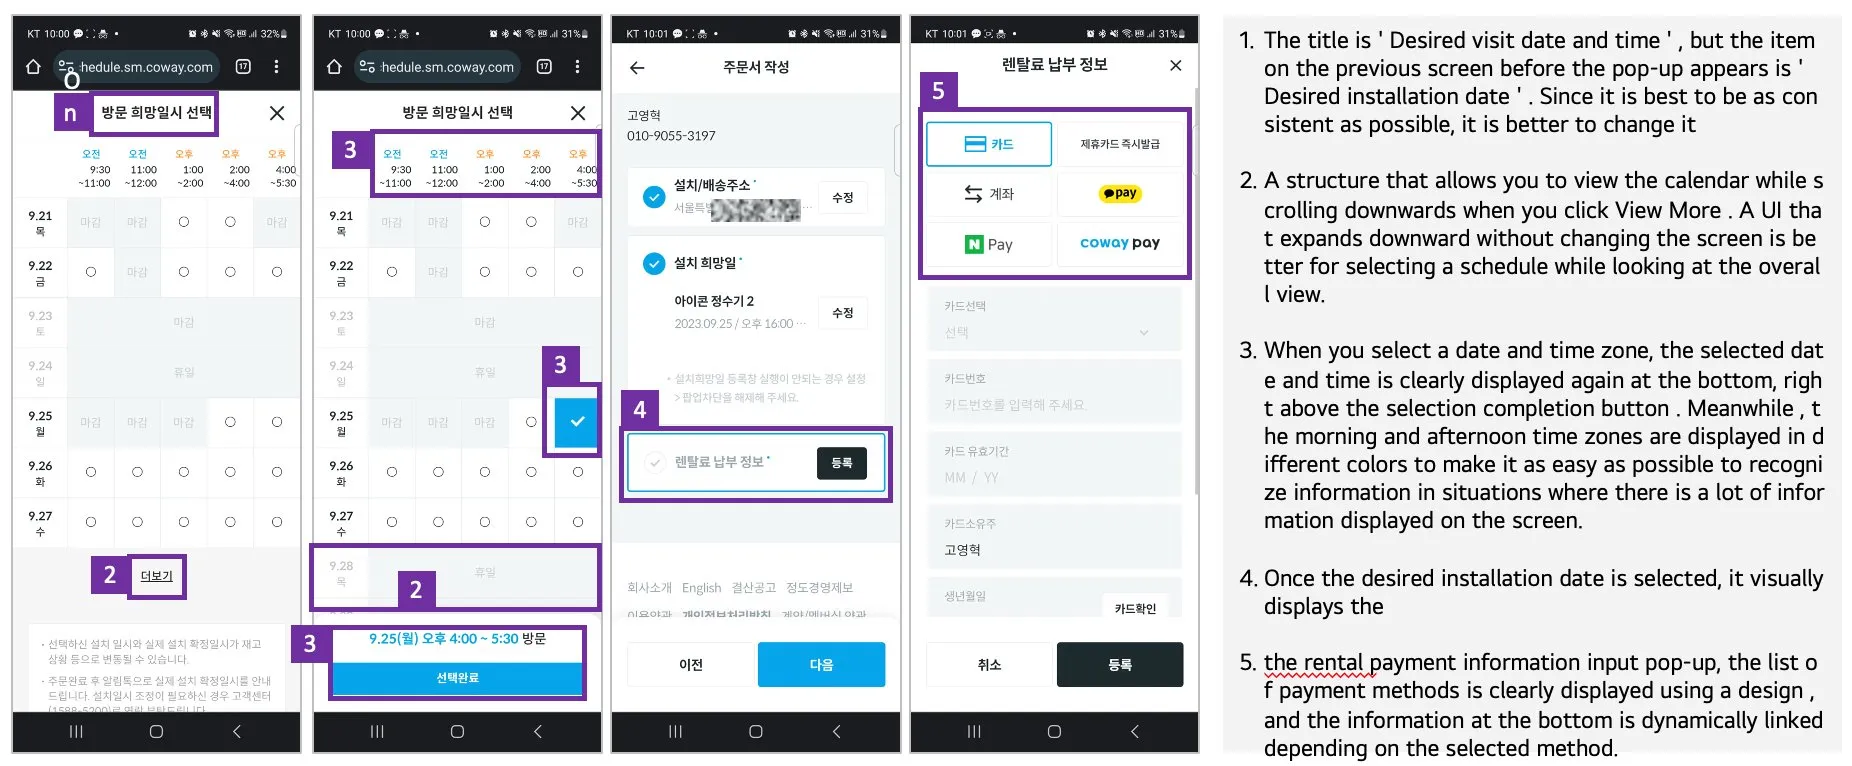
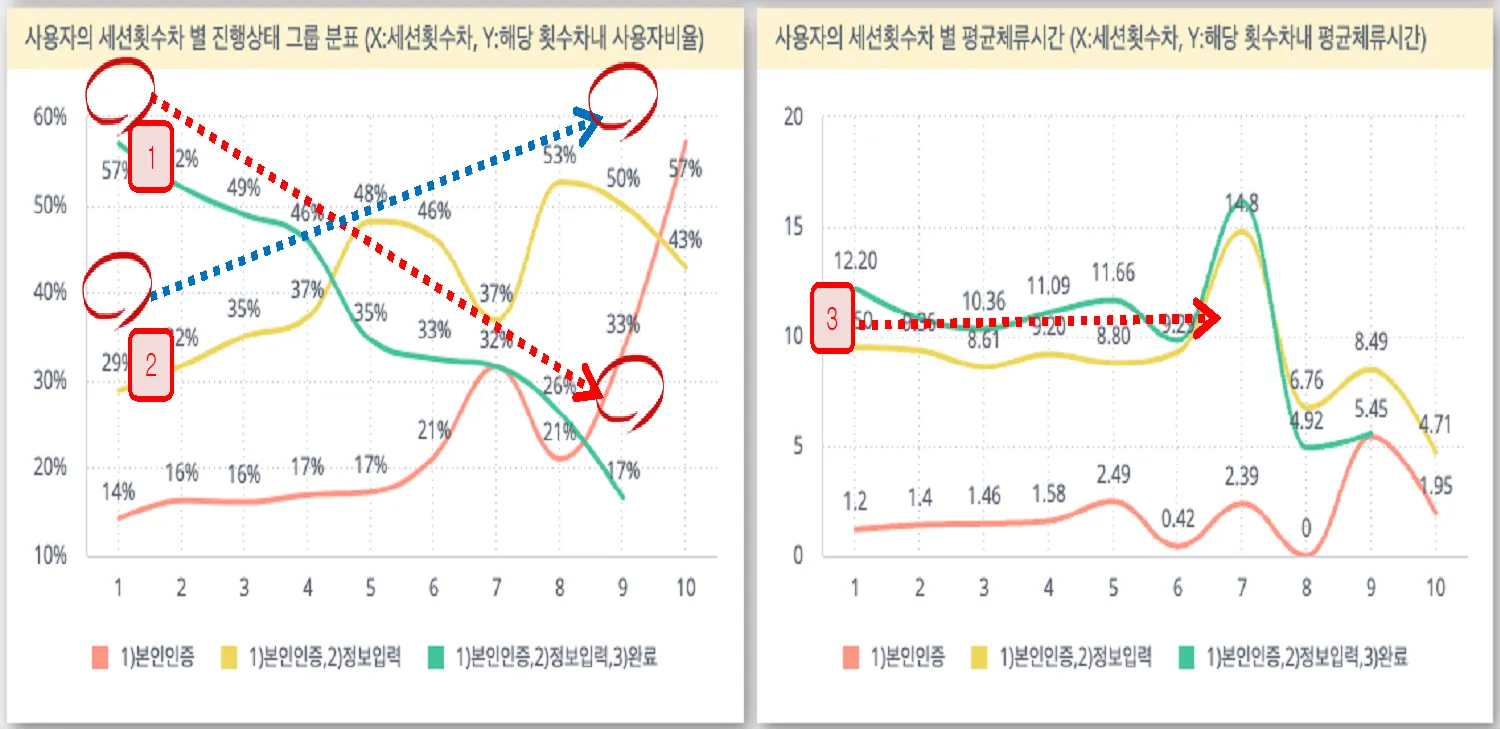
ADA validated these findings through quantitative analysis, complemented by expert UX evaluations and benchmarking against competitor websites. We also established an always-on monitoring framework to continuously track website performance and support ongoing UX optimisation.
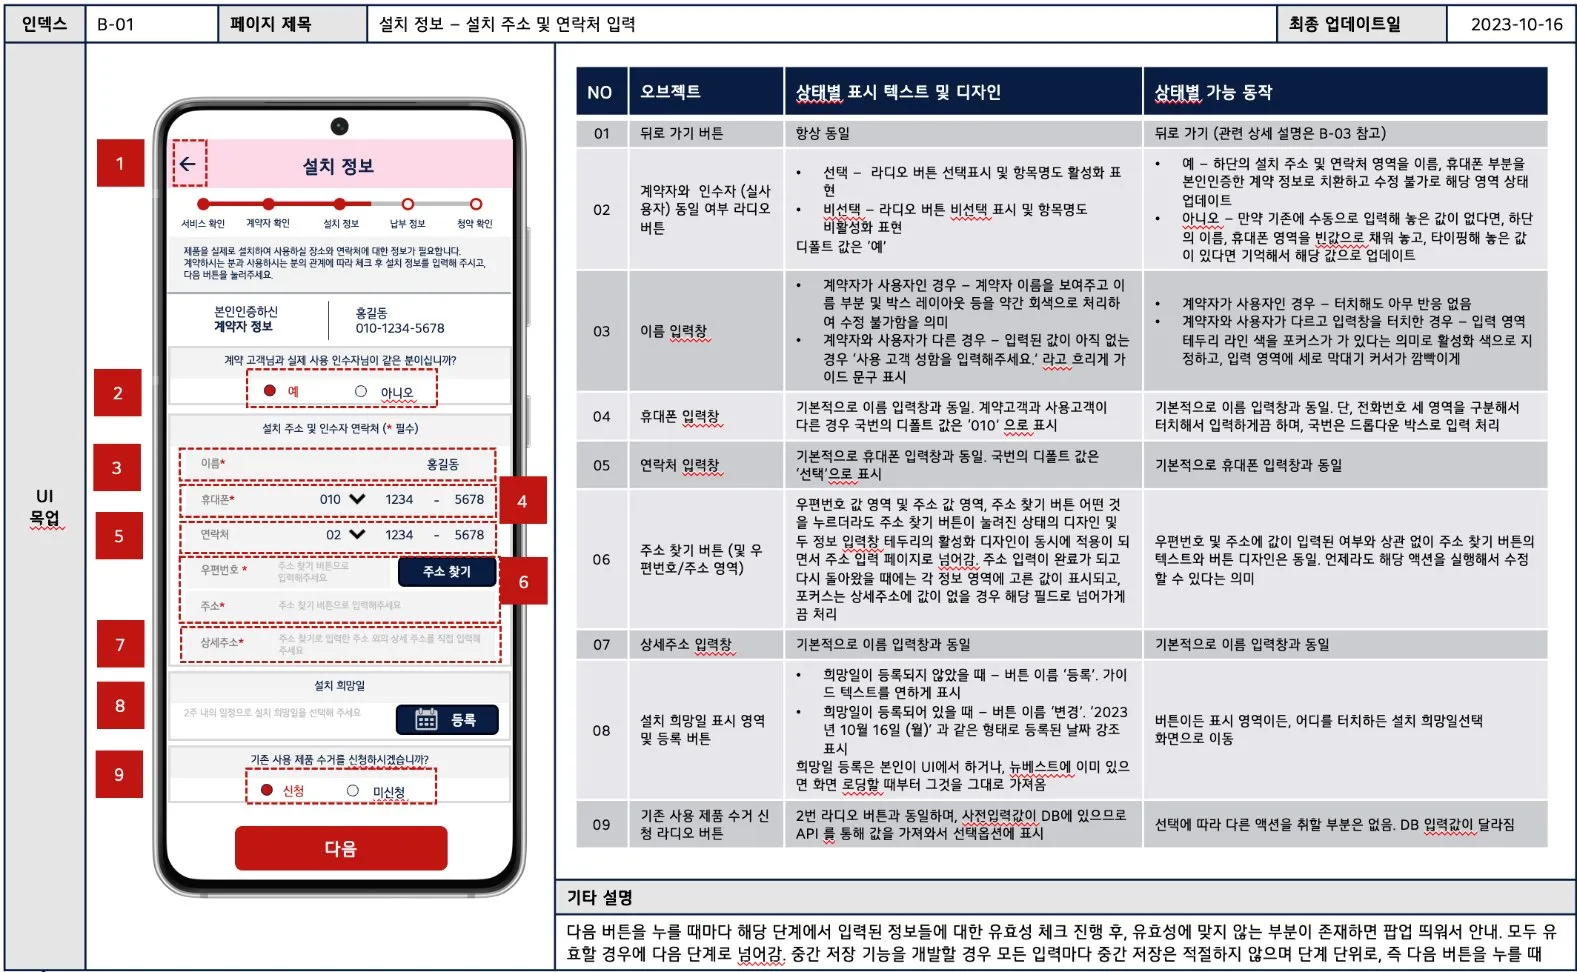
In addition, ADA developed interactive data dashboards to identify specific user interface (UI) improvement opportunities, analyse user journey bottlenecks that affected conversion goals, and uncover behavioural patterns among non-converting visitors.
These data-driven insights formed the foundation for ADA’s UX redesign strategy, enabling targeted website enhancements that improved the overall customer experience and supported higher service conversion rates.
The Execution
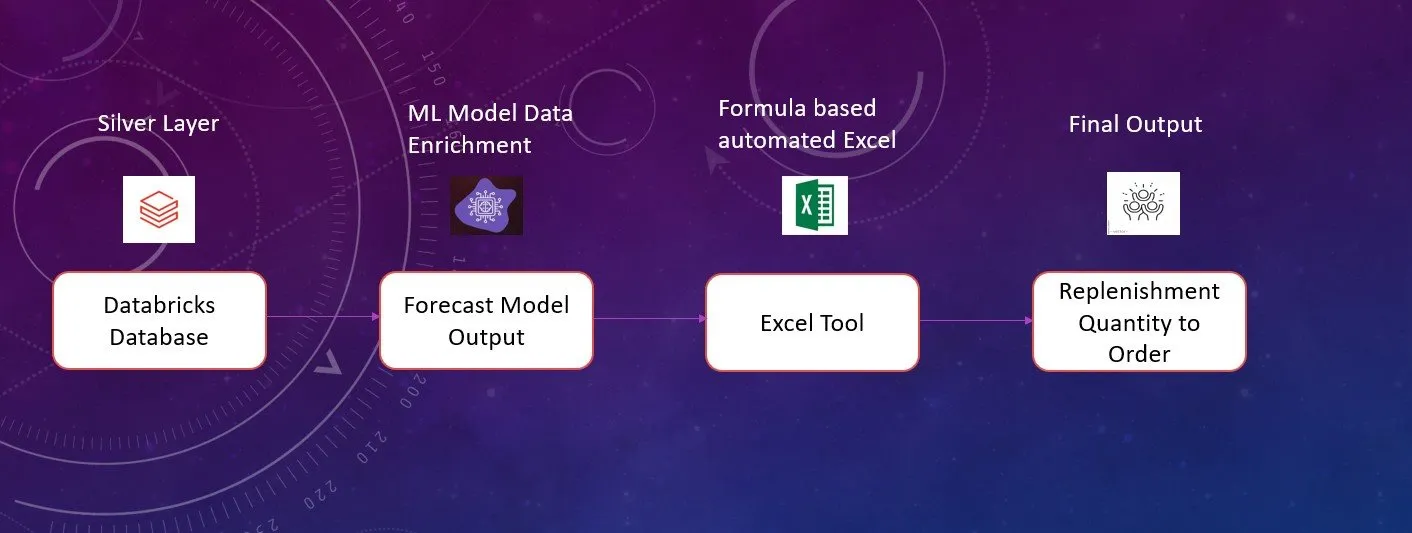
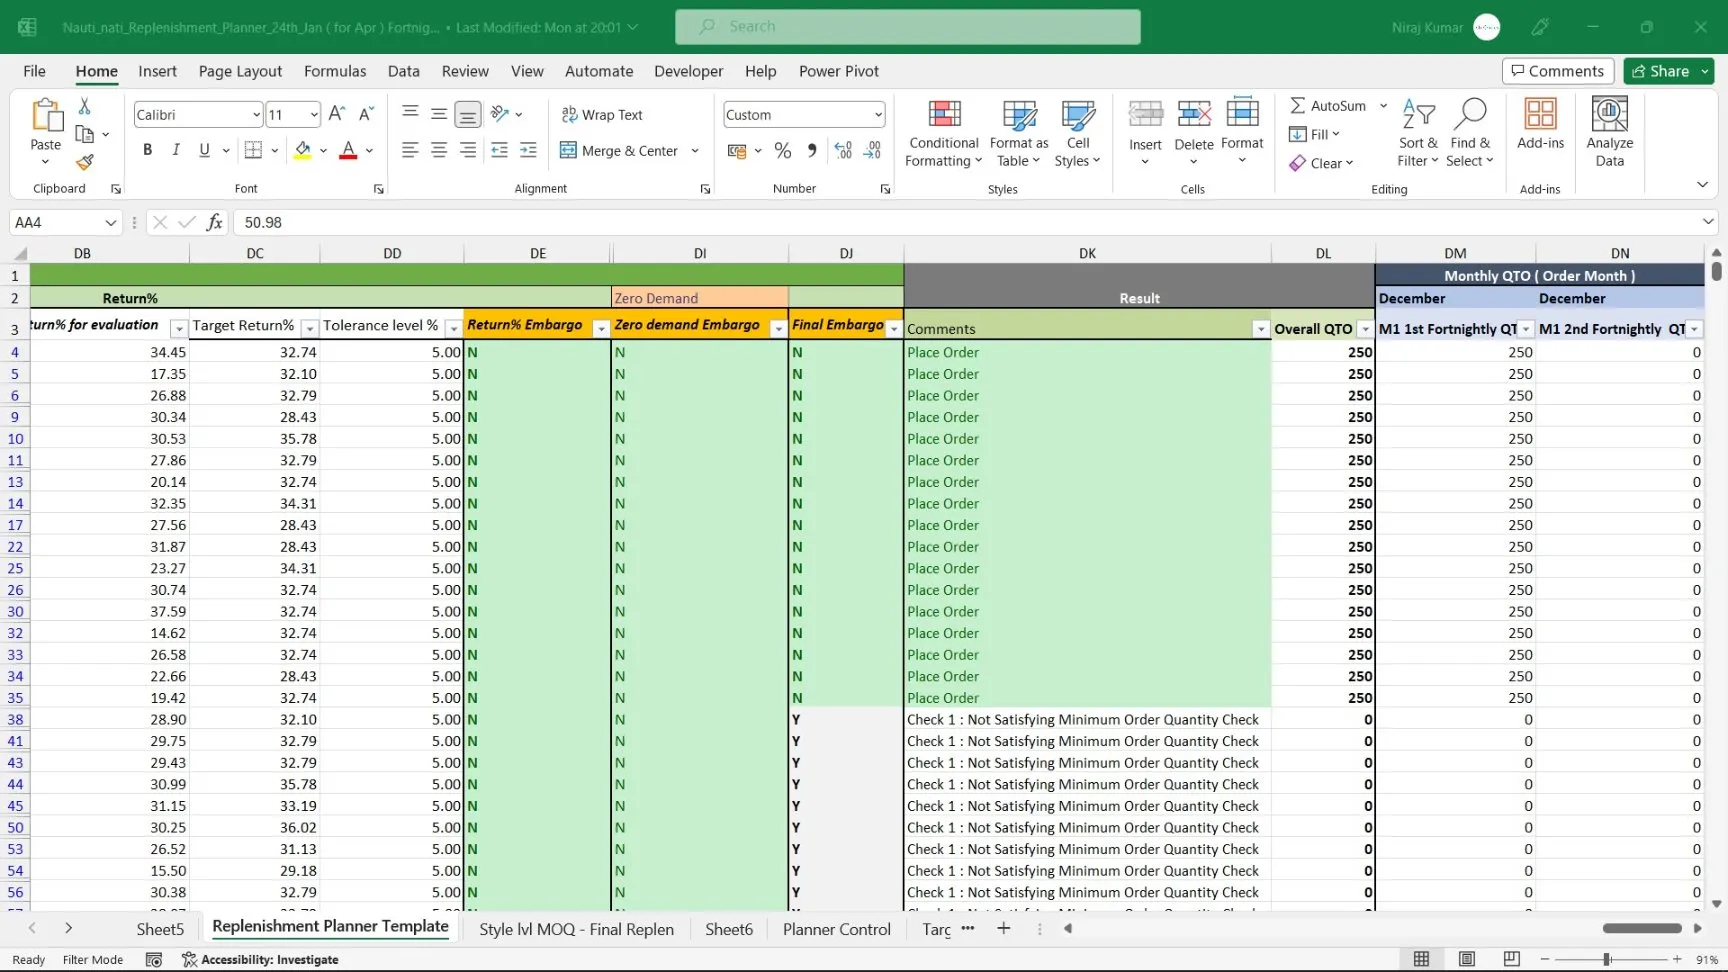
ADA developed a robust demand forecasting solution using advanced forecasting techniques, including ARIMA, Structural Equation Modelling (SEM), and Facebook Prophet, complemented by an intuitive Excel-based planning tool for business users.
The Supply Chain and Growth teams gained access to a bi-weekly updated planning tool that provides a comprehensive view of inventory levels across multiple supply chain tiers. The solution enables teams to adjust forecasts and place inventory orders based on business targets and operational requirements.
By replacing manual planning with data-driven forecasting, the solution empowers stakeholders to make faster, more informed decisions. This scientific approach improves operational efficiency, optimises inventory planning, and ensures strategic decisions are supported by predictive analytics and quantitative insights.
Explore More Resources on Personalized Marketing