

We helped a multi-national electronics firm improve performance by enabling data-driven, automated decision making

The Results
Improved visibility u0026 planning for BU Performance across HQ u0026 RHQ.
Dynamic u0026 Interactive dashboards that provide data across multiple cuts and levels.
Automated report refresh with no manual effort u0026 zero errors.
The Challenge
Optimizing the performance of individual business units is a cornerstone of sustained success. Our client, a renowned Japanese multinational conglomerate, operates across diverse sectors, including photography, electronics, biotechnology, and chemicals.
However, confronted with the challenge of manual reporting processes, they sought a streamlined solution to automate analytics for headquarters (HQ) and regional HQs across their various business units.
To address this pressing need, our client embarked on the implementation of a Business Intelligence (BI) Dashboard. Through this initiative, our client aims to enhance efficiency and maintain its leadership across multiple industries.
The Solution
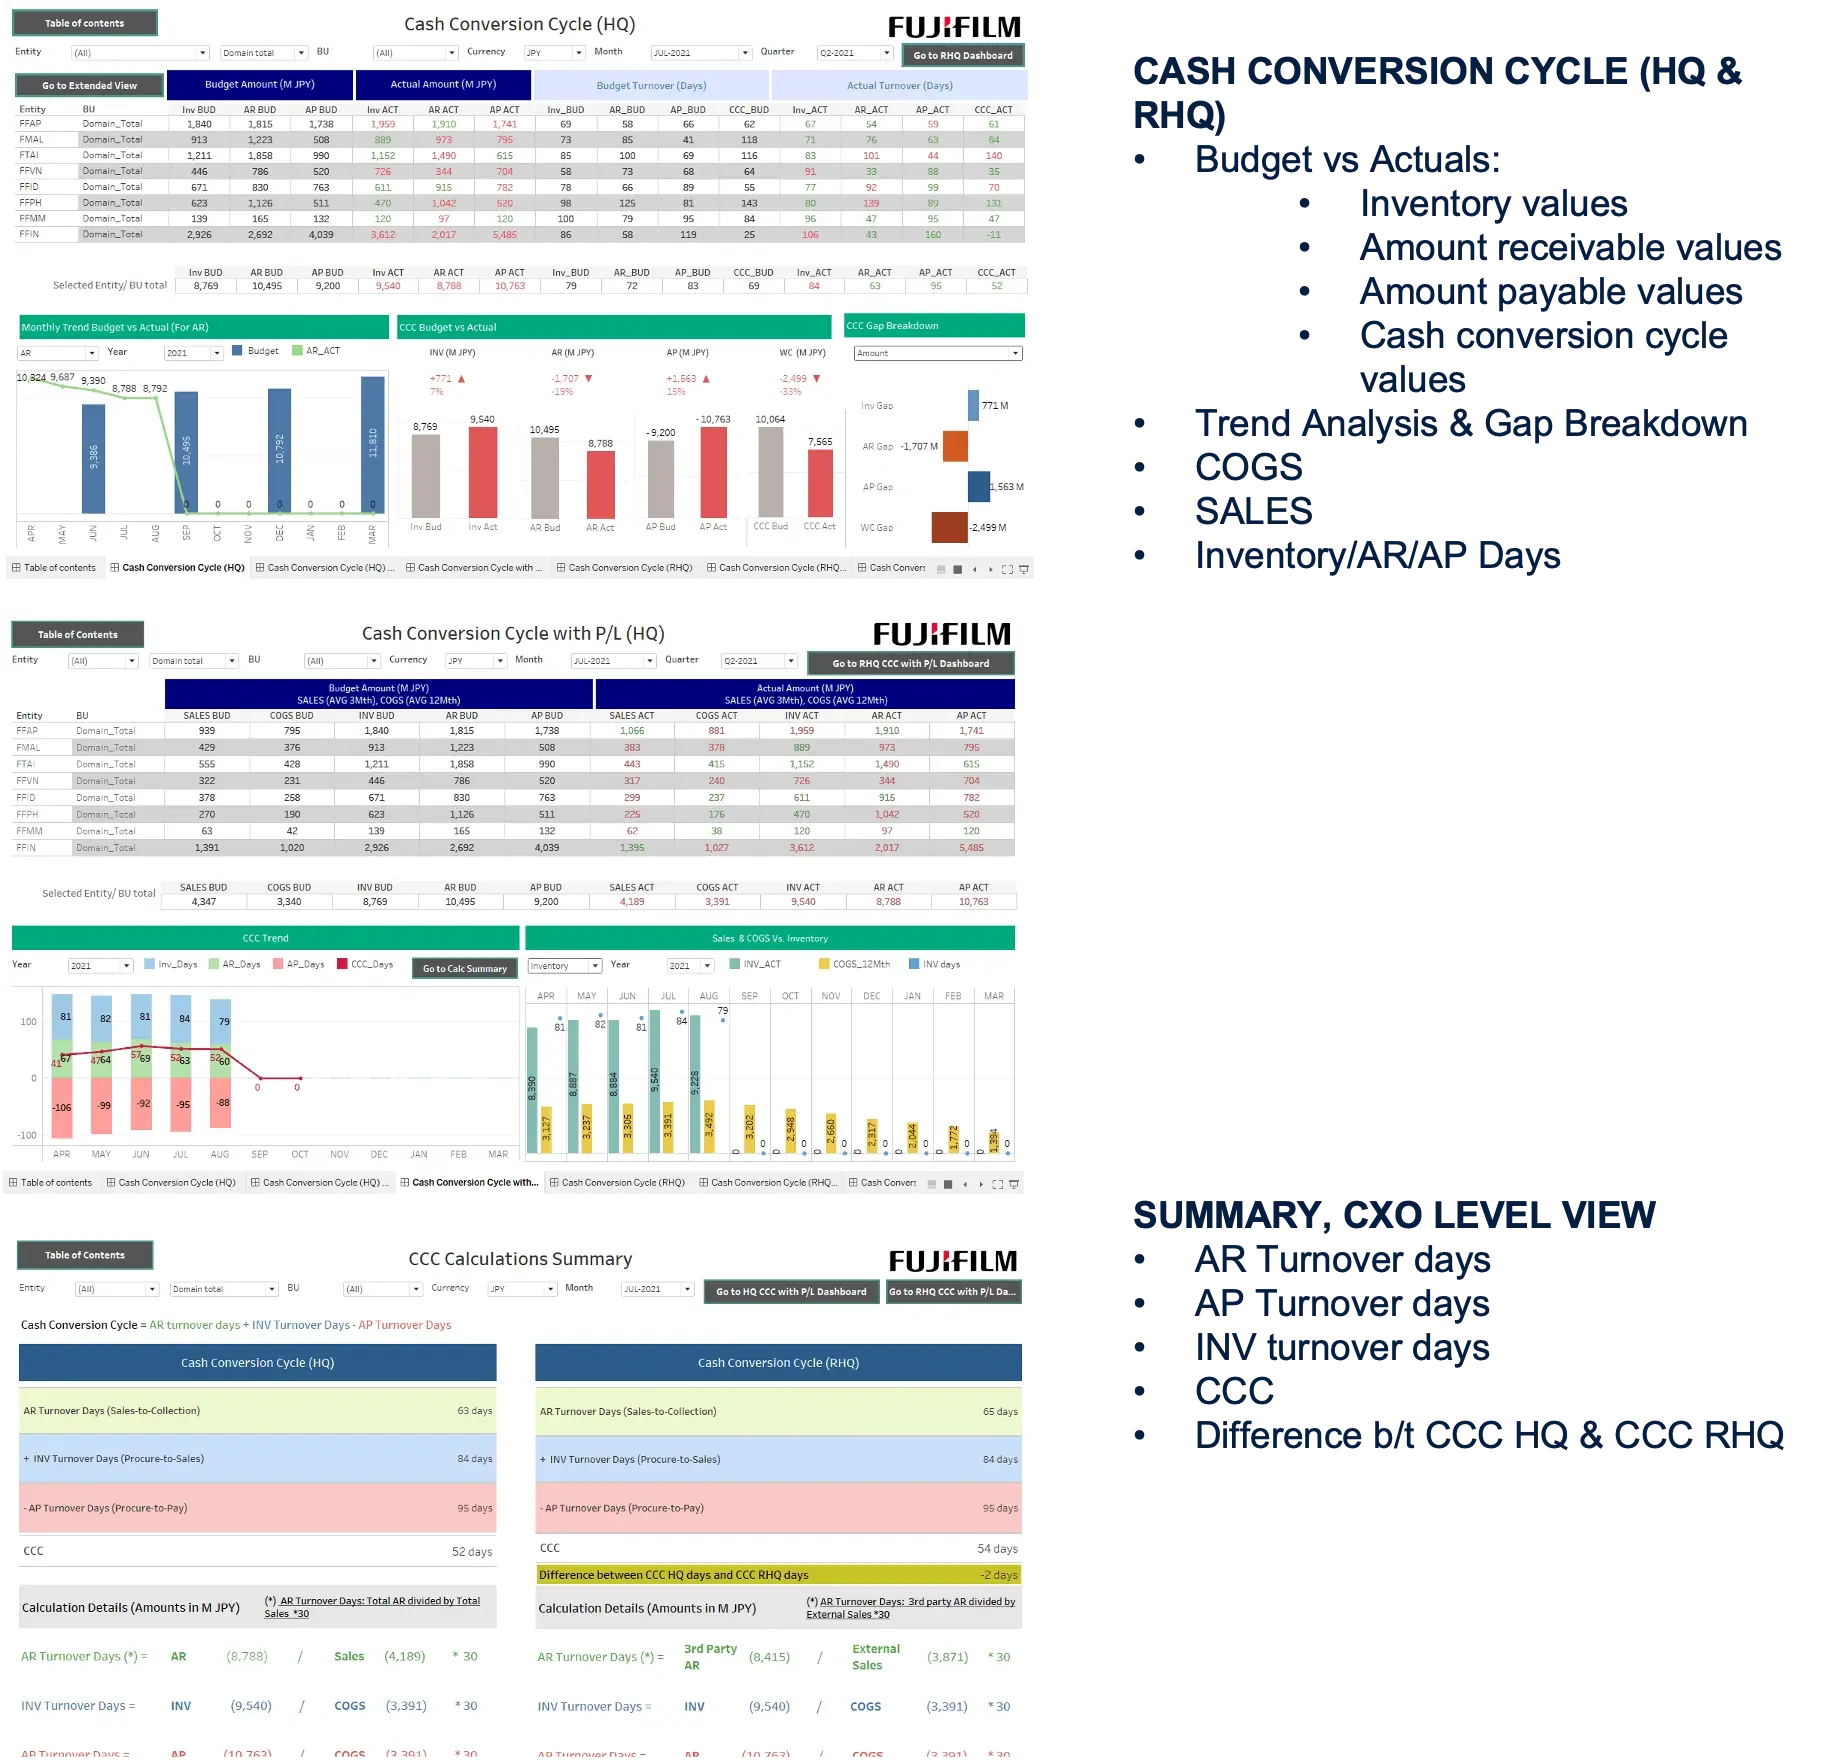
We developed a Business Intelligence (BI) Dashboard—an automated tool that enables real-time analysis of financial performance, eliminating manual efforts and providing actionable insights.
Cash Conversion Cycle
- Cash Conversion Cycle: Trend of Budget vs Actual
- Amount Receivable & Payable
- Inventory Trend
- Gap Analysis: Inventory, AR, AP, WC
Corporate Level View
- HQ vs Regional HQ Analysis
- COGS, Sales, & AR/AP Days
- Business Unit Level Analysis & Comparison
Planning
- AR, AP, & Inventory Turnover Days
- Cash Cycle Conversion Days
- Business Unit Level Analysis & Comparison
Dashboard Visualization Examples
Explore More Resources on Commerce Personalization